


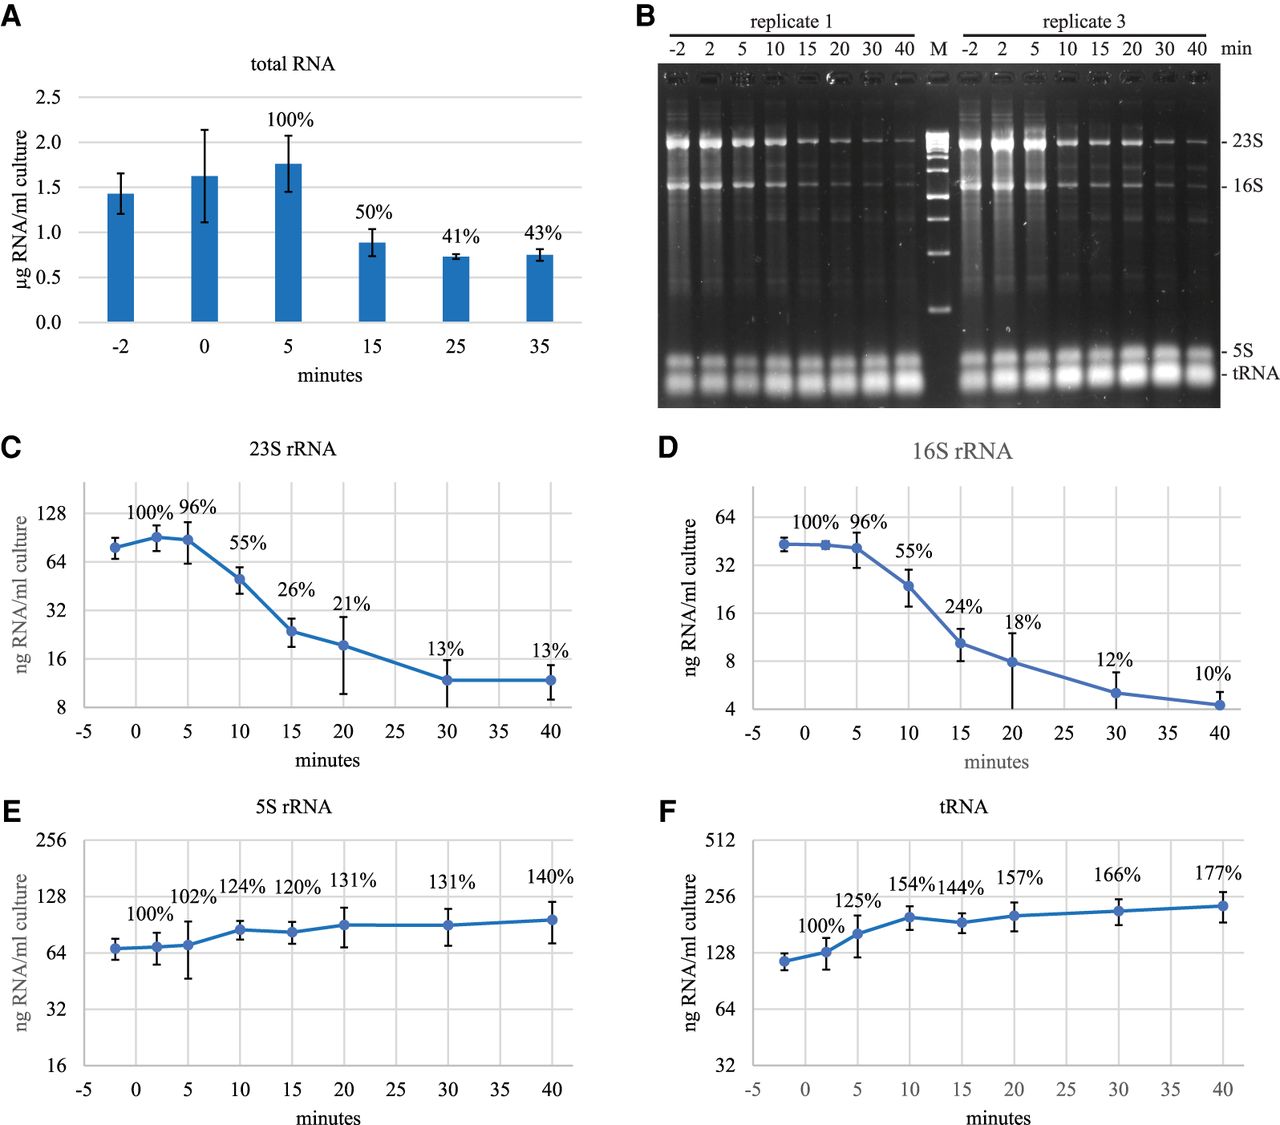
RNA levels after rifampicin treatment. The Kti162 strain was grown in LB at 37°C to OD600 = 0.5 and then treated with rifampicin (150 µg/mL). (A) Total RNA. The 0 min time point was taken immediately after the addition of rifampicin. RNA was extracted from equal volumes of culture. Quantities are expressed as micrograms of RNA per mL of culture. The graph shows the average and standard deviation of three biological replicates. Percentages indicate levels relative to the 5 min time point. (B) RNA was fractionated on 2.4% agarose gels and then stained with SYBR Safe. A gel loaded with RNA from two biological replicates is shown. M = double-stranded DNA size markers. (C–F) Levels of 23S, 16S and 5S rRNA, and tRNA after rifampicin addition were quantified from three biological replicates. Nominal amounts of RNA were determined using the fluorescence of known quantities of the 500 and 1500 bp double-stranded DNA size markers as standards. The graphs show the average and standard deviation expressed as nanograms of RNA per mL of culture. Percentages indicate levels relative to the 2 min time point.




