


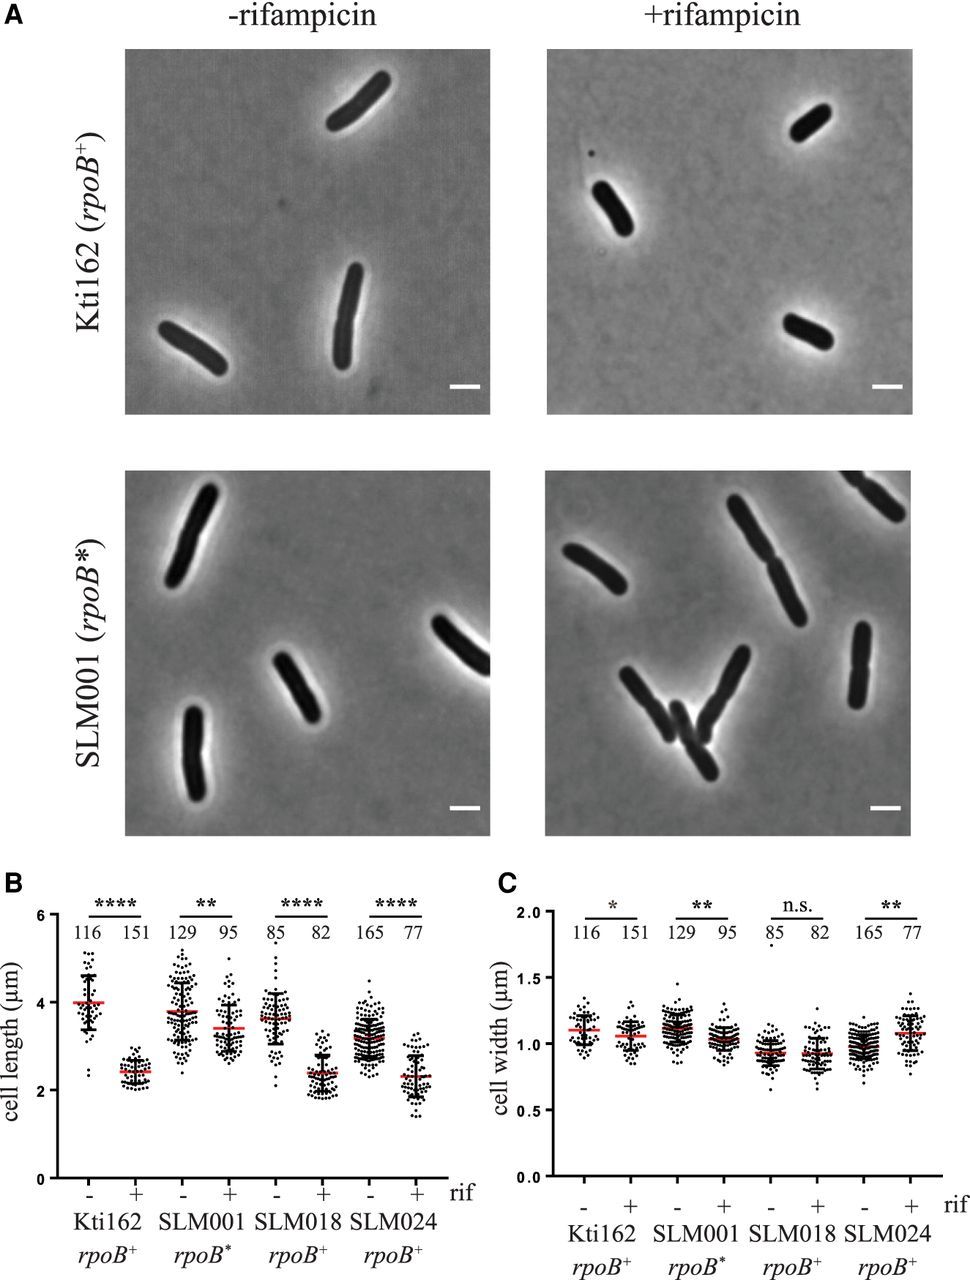
Cell dimensions. The Kti162 strain expressing RNase E-mCherry, SLM018 strain expressing PNPase-msfGFP, SLM024 strain expressing RhlB-msfGFP, and the isogenic rifampicin resistant strain SLM001 were grown to OD600 = 0.5 in LB at 37°C. (A) Phase contrast images before and 30 min after adding rifampicin (150 µg/mL). The bar in the lower right corner of each micrograph indicates scale (2 µm). (B,C) Scatter plots of cell length (B) and width (C). Since the results of two independent experiments were the same, the data were pooled. The number of cells that were measured are indicated at the top of the distribution profile. Statistical significance of the difference between untreated and rifampicin treated cells was calculated using the nonparametric Mann–Whitney test: (****) P < 0.0001; (***) 0.0001 < P < 0.001; (**) 0.001 < P < 0.01; (*) 0.01 < P < 0.05; n.s. = P > 0.05.




