


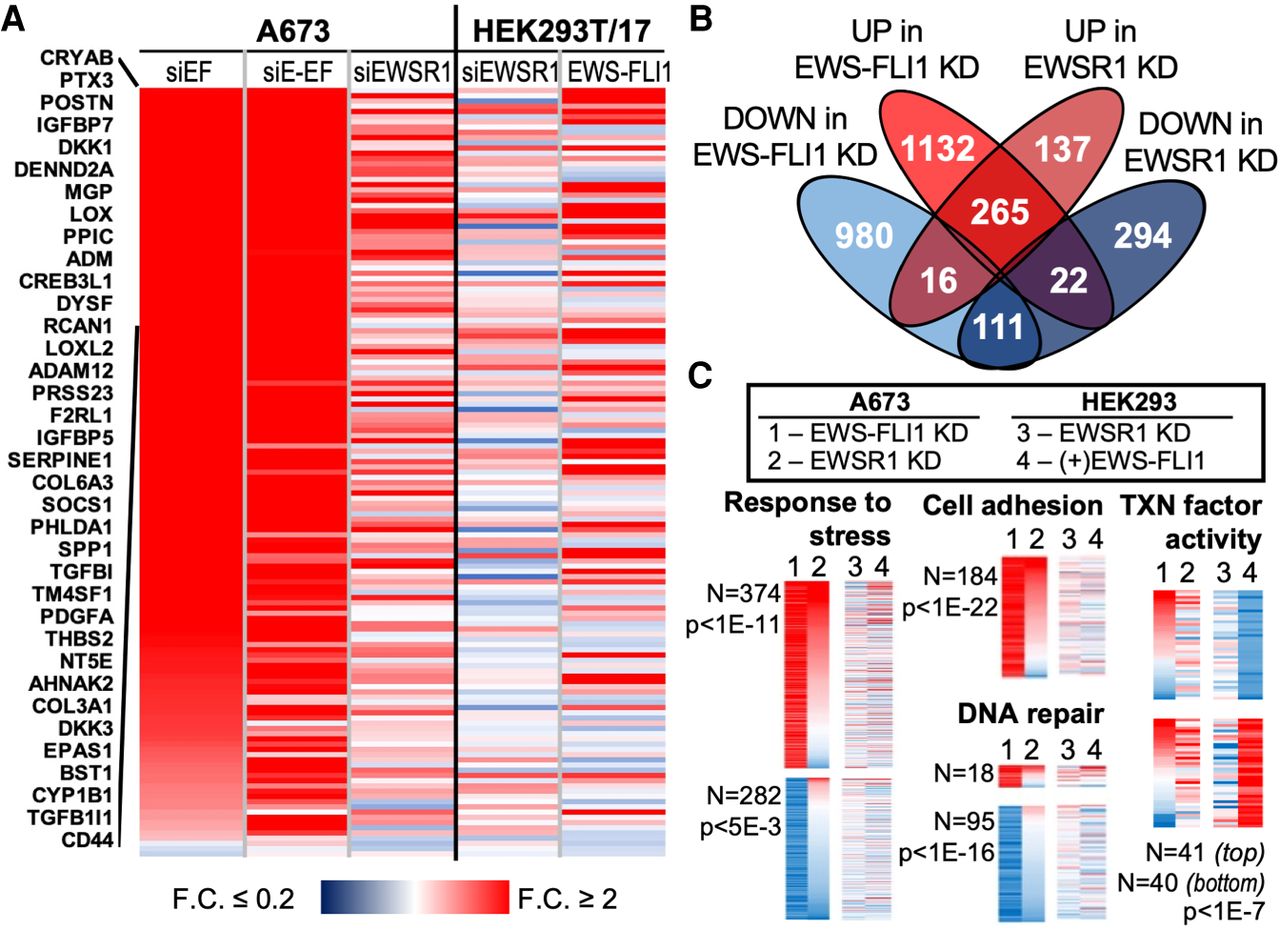
Many transcripts are similarly affected by knockdown of EWS-FLI1 or EWSR1 in Ewing sarcoma. (A) A heat map shows fold changes for the 147 signature genes repressed by EWS-FLI1 in A673 cells. Results are sorted according to change in the siEF treatment, with names of the 39 most affected genes shown. Changes to mRNA levels in HEK293T/17 after knockdown by siEWSR1 or expression of EWS-FLI1 in HEK293T/17 cells are also shown. (B) The Venn diagram shows overlaps in transcripts increased or decreased by the knockdown (KD) of EWS-FLI1 or EWSR1 in A673 cells. The threshold required for increased or decreased transcripts was 1.6-fold change and adjusted P-value, P-adj < 0.05. (C) Heat maps show changes in transcript abundances in A673 after EWS-FLI1 (1) or EWSR1 (2) knockdown or in HEK293T/17 after EWSR1 knockdown (3) or EWS-FLI1 (4) expression. Included genes were taken from selected GO associations identified among those affected by the EWS-FLI1 knockdown: response to stress (GO:0006950), cell adhesion (GO:0007155), and DNA repair (GO:0006281). These are sorted by changes from EWS-FLI1 (1), then EWSR1 (2) knockdown. Changes of genes associated with transcription factor activity (GO:0003700) are shown for those affected by exogenous EWS-FLI1 in HEK293T/17 cells. The number of genes plotted is indicated and adjusted P-values corrected by the Benjamini and Hochberg false discovery rate.




