


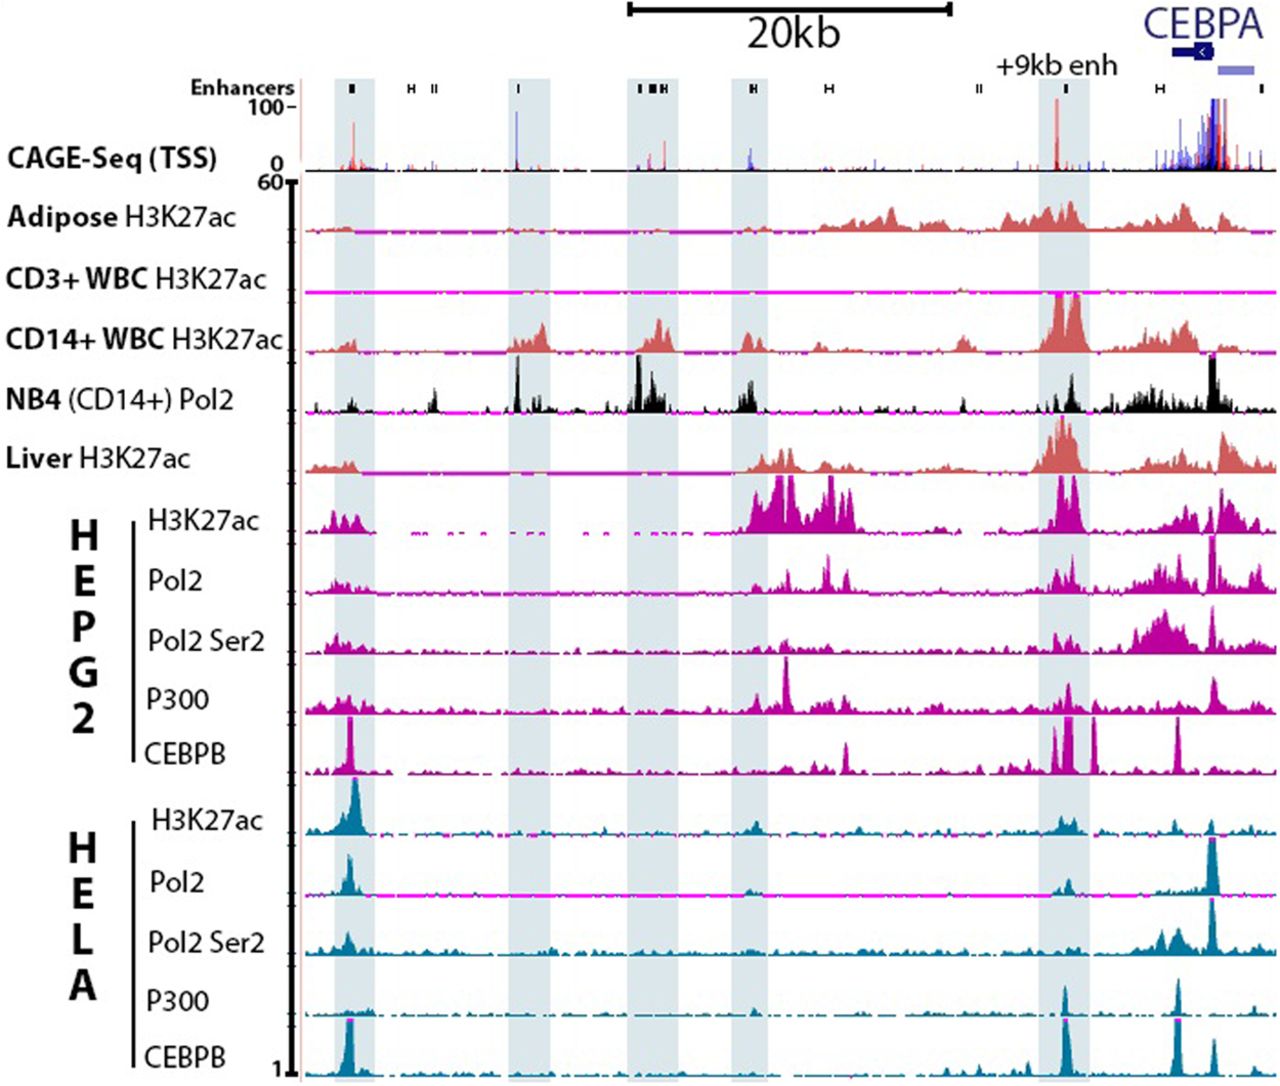
Analysis of “active” enhancers (H3K27ac) and active transcription (Pol II occupancy and CAGE-seq data) reveals differences between human cell types. Predicted enhancers are demarcated as black rectangles (FANTOM5–RIKEN). CAGE-seq data (FANTOM5–RIKEN) shows sites of active transcription (red: positive strand, blue: negative strand). CAGE-seq data is shown as an amalgamation of reads from different primary cell samples, including monocytes and adipocytes, which show active transcription from enhancers. H3K27ac status is depicted for primary adipose, CD3+ WBCs (lymphoid origin), CD14+ WBCs of myeloid origin, and hepatocytes (Roadmap Epigenomics Project), as well as the cancer cell lines HepG2 and HeLa. Pol II (ENCODE) and Pol II Ser2 signals overlap with CAGE-seq reads at enhancers (blue highlights). P300 binding is included as an additional marker of enhancers. CEBPB binding is one example of a transcription factor which binds to one or more of the CEBPA enhancers. A clear difference in H3K27ac, Pol II, and Pol II Ser2 status at the CRED9 is observed between HepG2 (CEBPA expressing) and HeLa (CEBPA suppressed). (See Materials and Methods for track information.)




