


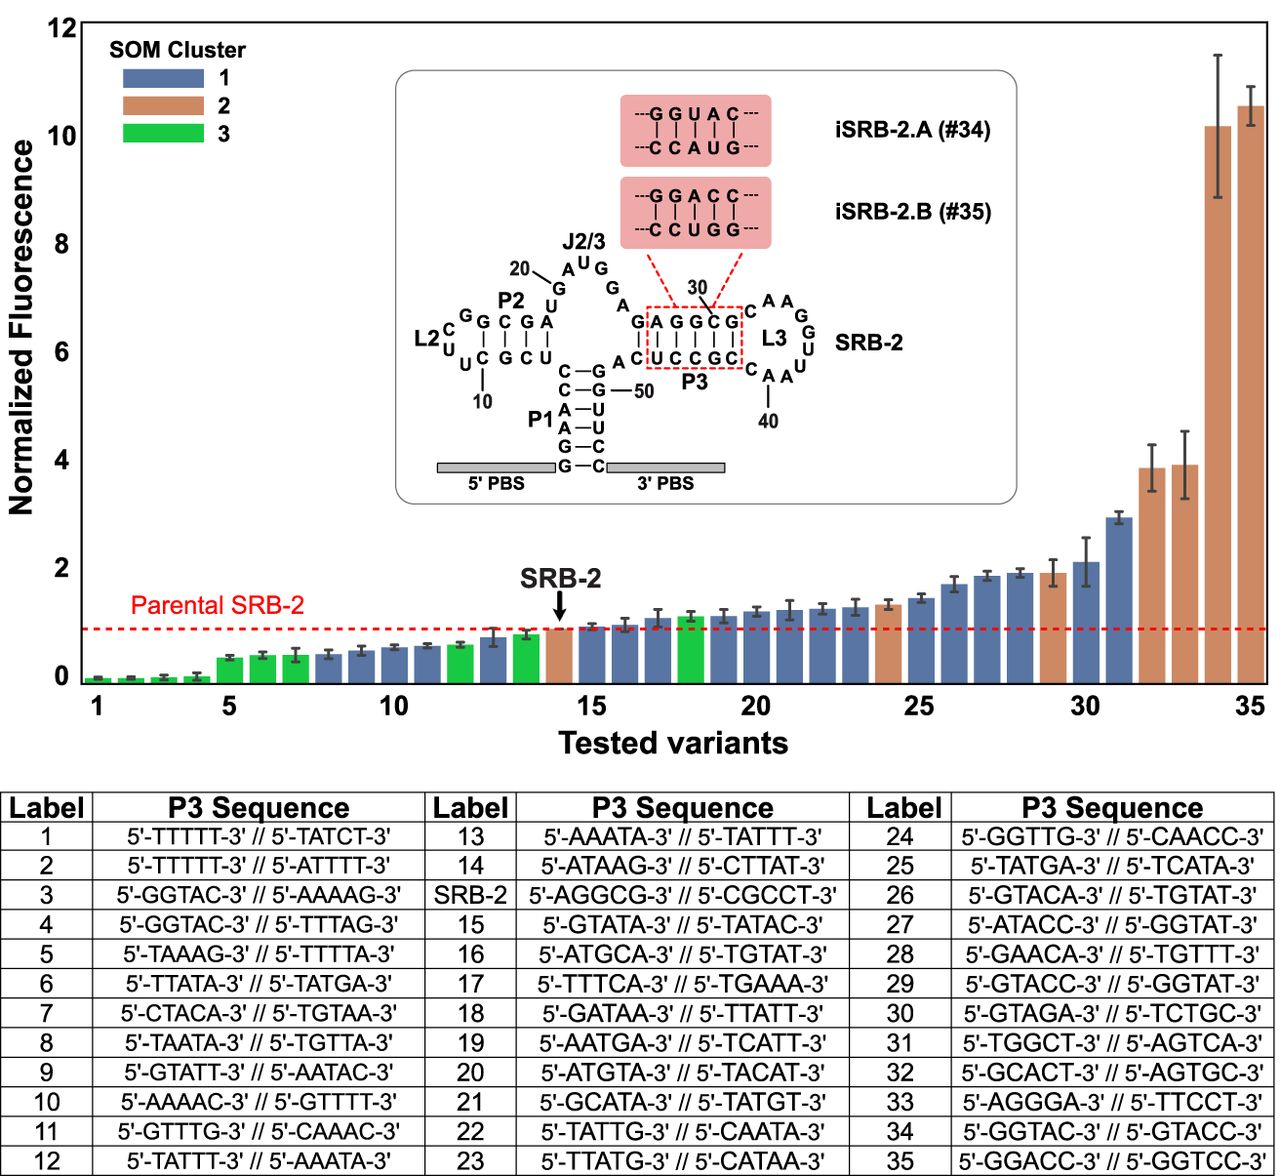
Functional analysis of SRB-2 mutants. Different sequences were selected from the self-organizing map (SOM) shown on Figure 5. Each construct was in vitro transcribed in the presence of 500 nM of Gemini-561 and the fluorescence monitored over time. The fluorescence apparition rate was computed and normalized to that of the parental SRB-2 aptamer. The values are the mean of n = 3 independent experiments. The error bars correspond to ±1 SD. The bars are color-coded with respect to the SOM cluster from which the sequence was originally selected. The P3 sequence of each variant is given in the table under the plot. Sequences of both strands of the stem were concatenated into a single line.




