


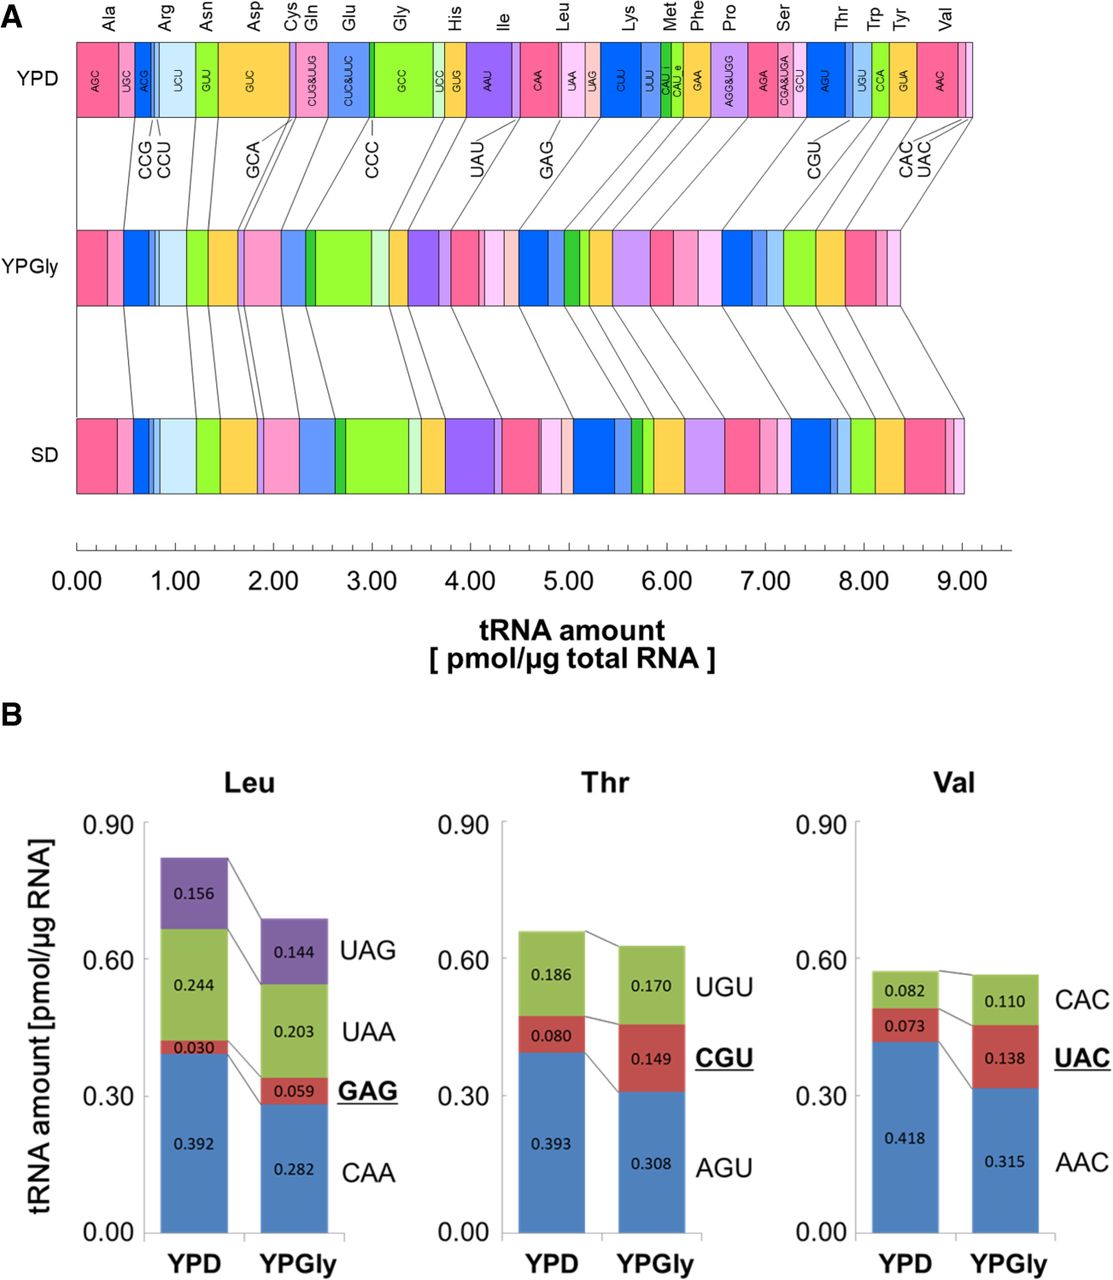
FIGURE 4.
Comparisons of tRNA amounts in the yeast cells growing in different media. (A) Comparison of tRNA amounts in the RNA samples prepared from log phase cells grown in YPD (top), YPGly (middle), and SD (bottom). The width of each bar represents the absolute amount of the indicated isoacceptor tRNA. (B) Alteration of isoacceptor contents in yeast cells grown in different carbon sources. The tRNA amounts of individual isoacceptors for tRNA-Leu (left), tRNA-Thr (center), and tRNA-Val (right) in yeast cells grown either in YPD or in YPGly are shown as bar graphs.




