


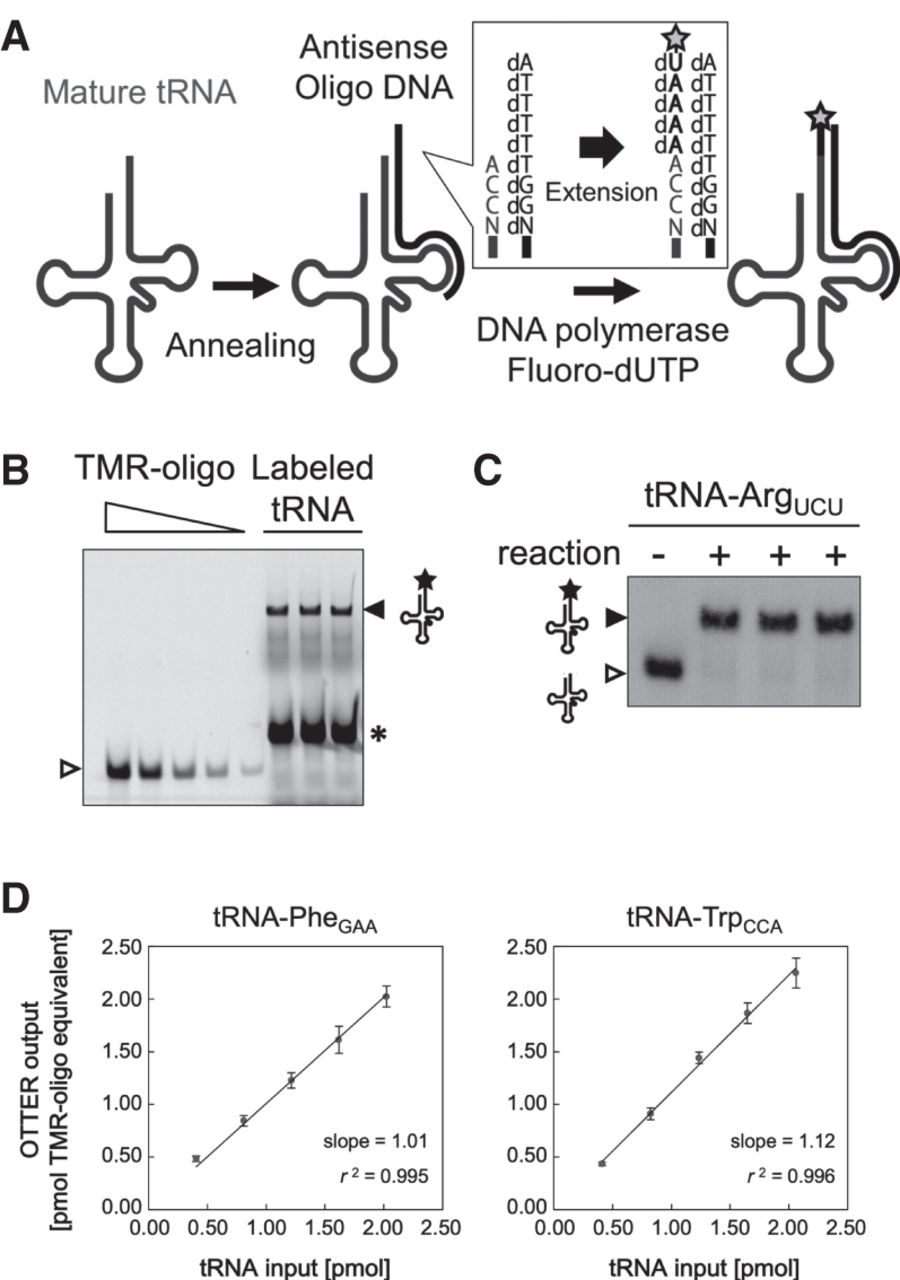
tRNA quantification using OTTER. (A) Schematic drawing of the tRNA fluorescence-labeling reaction in OTTER. A target tRNA is first hybridized with a specifically designed antisense oligo DNA with a 5′-extension of dAdTdTdTdT (Type 1 oligo DNA). The overhang in the tRNA/DNA hybrid is then filled by Klenow fragment (3′–5′ exo−) with dATP and fluorescence-labeled dUTP (such as TMR-dUTP; marked by a star) as substrates. (B) An example for tRNA-ArgUCU quantification using OTTER. Three replicates of a typical reaction were analyzed by urea-PAGE and fluorescence scanning. The fluorescence-labeled tRNA-ArgUCU (closed triangle) and the fluorescence-labeled template oligo DNA generated by a weak RT activity of the Klenow fragment (asterisk) were detected. Since the 3′ end of the oligo DNA hybridized to the TΨC region, which is rather conserved among different tRNA species, unrelated tRNAs can also act as templates to produce the strong RT signal. The standard TMR-oligo DNA (open triangle) was loaded onto the gel at 0.500, 0.250, 0.100, 0.050, and 0.020 pmol/lane. (C) The three OTTER reaction products for tRNA-ArgUCU shown in B (“+” lanes) and a reaction without the template oligo DNA (“−” lane) were subjected to northern blotting. (D) The linearity and quantitativeness of the OTTER procedure were confirmed using in vitro-transcribed tRNAs as pure model substrates. Indicated molecular quantities of tRNA-PheGAA (left) or tRNA-TrpCCA (right) subjected to the OTTER reactions (tRNA input; 0.40, 0.81, 1.21, 1.62, or 2.02 pmol for tRNA-PheGAA, and 0.41, 0.82, 1.24, 1.65, or 2.06 pmol for tRNA-TrpCCA) were analyzed on polyacrylamide gels. The amounts of fluorescence-labeled tRNAs on the gels were determined from a calibration curve of known amounts of the standard TMR-oligo DNA on the same gels and were expressed in “pmol TMR-oligo equivalent.” Each data point is an average of three measurements of dilution series from three independent stocks of the in vitro transcripts, and an error bar indicates the standard deviation.




