


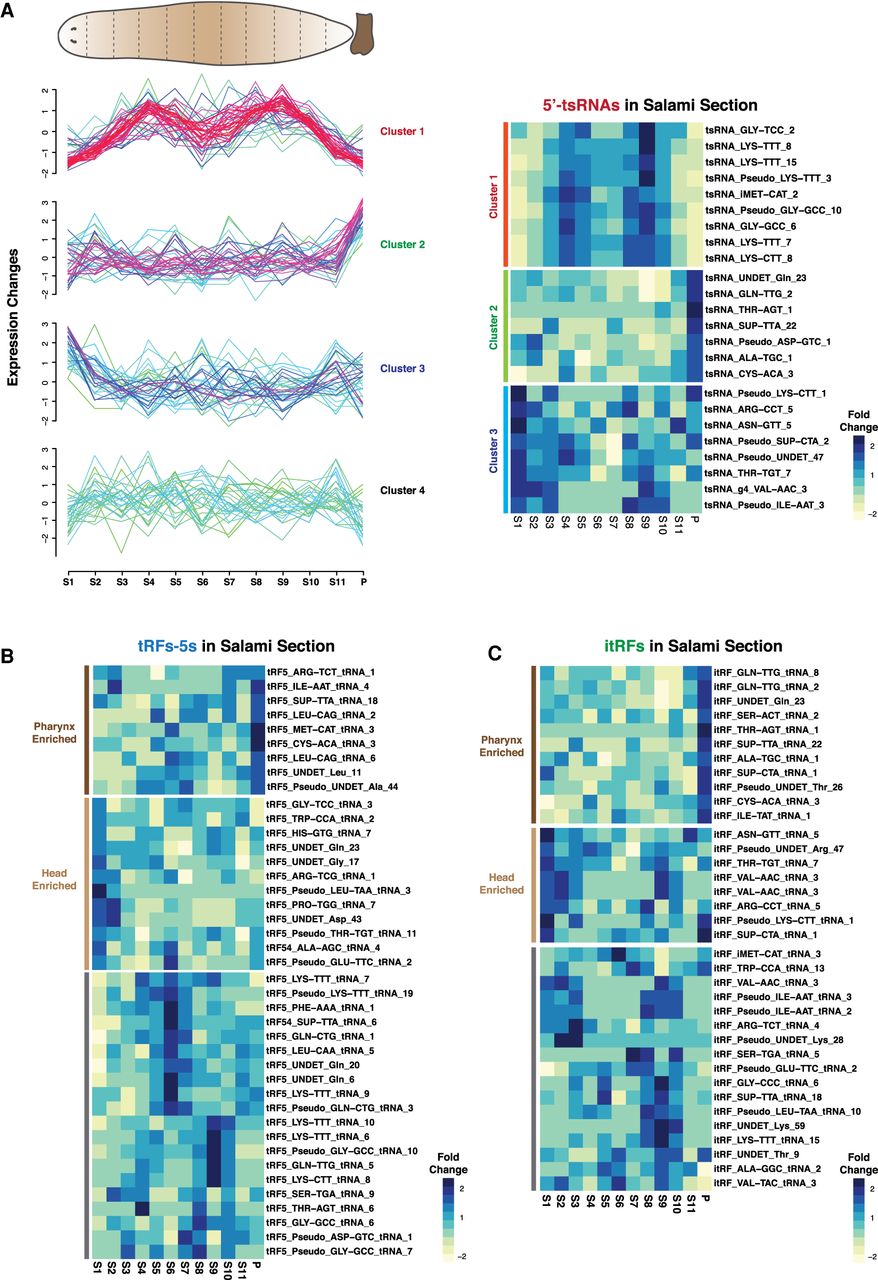
Spatial profiling of tRNA-derived small RNAs across planarian salami sections. (A) Expression profiles of 5′-tsRNAs across the different sections of planarian body identify three clusters of expression. In soft clustering, membership value represents how well a gene is represented in a cluster. The red and purple colors represent candidates with high membership value while yellow or green indicates candidates with low membership value. (A) Heatmaps of candidate 5′tsRNAs that show various patterns of observed expression. (B) Heatmaps of candidate tRF-5s across salami sections. The expressions are grouped based on high expression in head region, pharynx, or other regions of the planarian body. (C) Heatmaps of candidate itRFs across salami sections. The expressions are grouped based on high expression in head region, pharynx, or other regions of the planarian body.




