


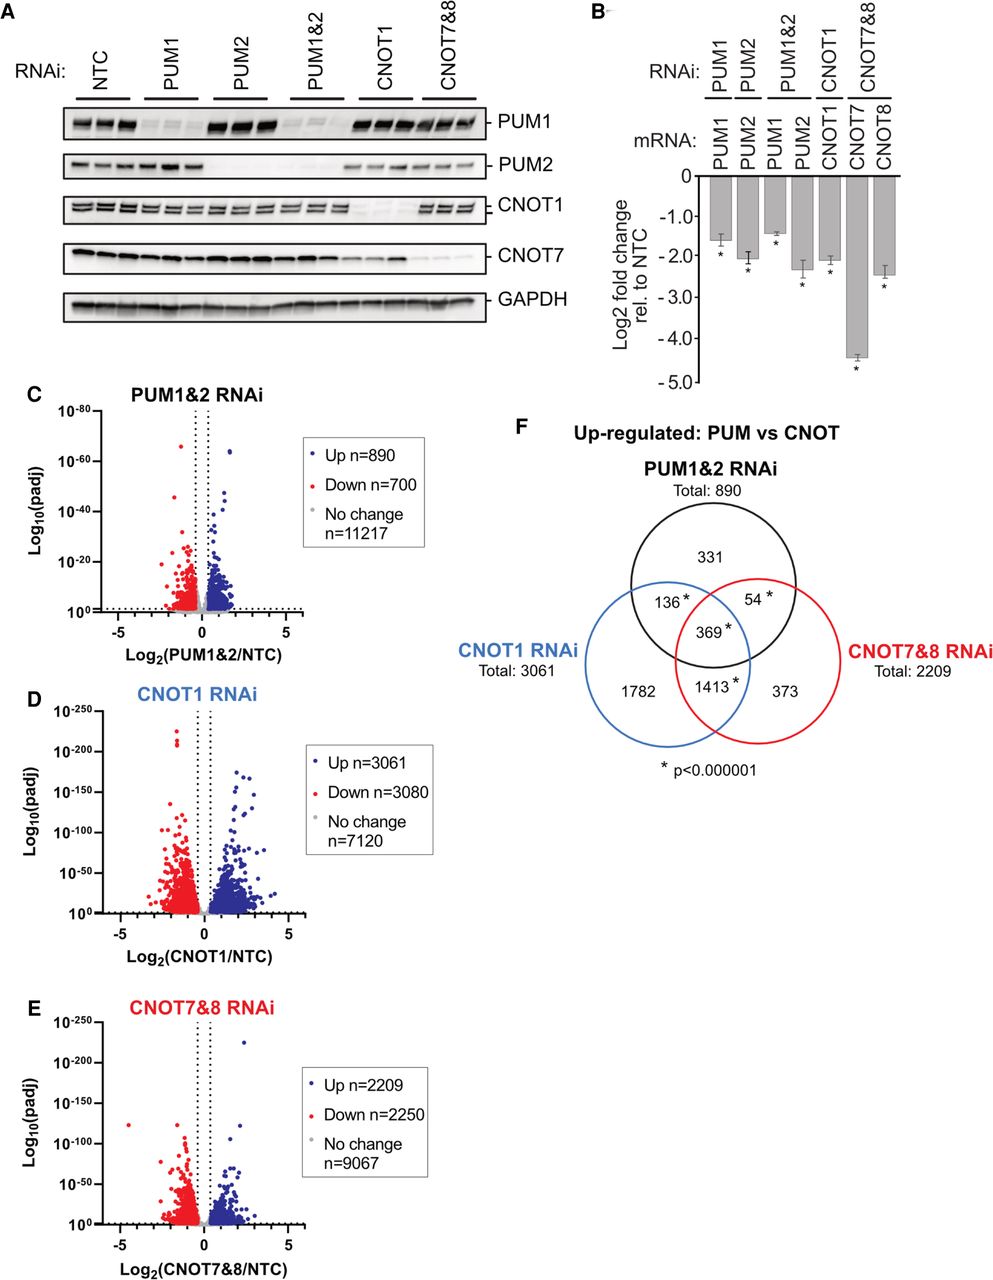
The PUM-CNOT axis regulates a substantial proportion of human transcriptome. (A) Western blot of RNAi depletion of PUM1, PUM2, or both simultaneously (PUM1&2), CNOT1, or CNOT7 and CNOT8 (CNOT7&8), from three biological replicates of HCT116 cells used for PAC-seq analysis. Cells treated with nontargeting control (NTC) siRNAs served as a negative control. GAPDH served as loading control. (B) RNAi depletion of PUM1, PUM2, CNOT1, CNOT7, and CNOT8 mRNAs measured in the PAC-seq data. Mean log2 fold change values ±SEM (Supplemental Table S1) are plotted relative to NTC. (*) P-value <0.05 relative to the NTC control. n = 3. (C–E) Volcano plots of statistical significance (adjusted P-value) versus mean log2 fold change of RNA levels, relative to NTC, measured by PAC-seq for each RNAi condition: (C) PUM1&2 RNAi; (D) CNOT1 RNAi; (E) CNOT7&8 RNAi. The number of genes that were up- or down-regulated by 1.3-fold or greater with an adjusted P-value <0.05 are reported in the inset box. PAC-seq data and statistics are reported in Supplemental Table S2. (F) Venn diagram of gene sets that were significantly up-regulated in each indicated RNAi condition. (*) P-value of <0.000001 (hypergeometric test for multiset overlap). Gene sets and statistics are reported in Supplemental Table S3.




