


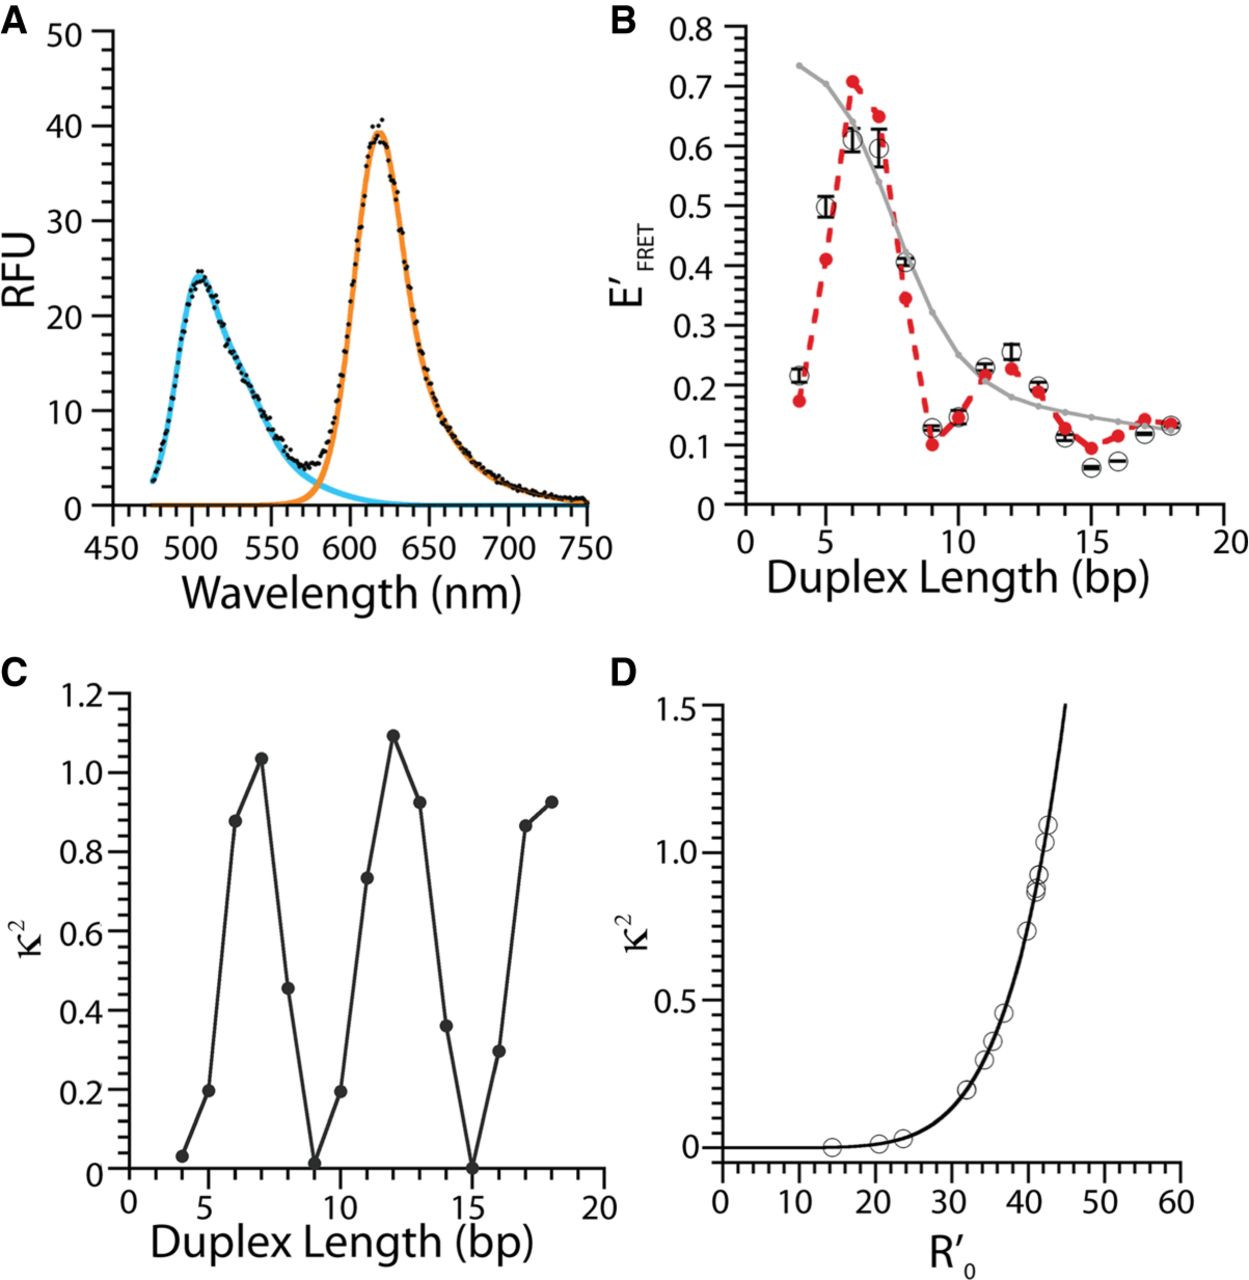
FRET efficiency as a function of duplex length. (A) FRET signal observed for the Broc-6bp-M3 duplex fit to a three parameter gaussian for the DFHBI-1T donor (blue) and YO3-Biotin acceptor (orange) (see Supplemental Fig. S3 for full set). (B) FRET efficiency as a function of helical extension calculated using Equations 4 and 5. Open black circles represent the averaged data points. Red circles with dashed red line represent the values fitted using the structural models. Gray line indicates the poor correlation of simulated data using a constant κ2 value of 2/3. (C) κ2 values determined from the model analysis over the apta-FRET series. (D) R′0 calculated for the observe apta-FRET κ2 range.




