


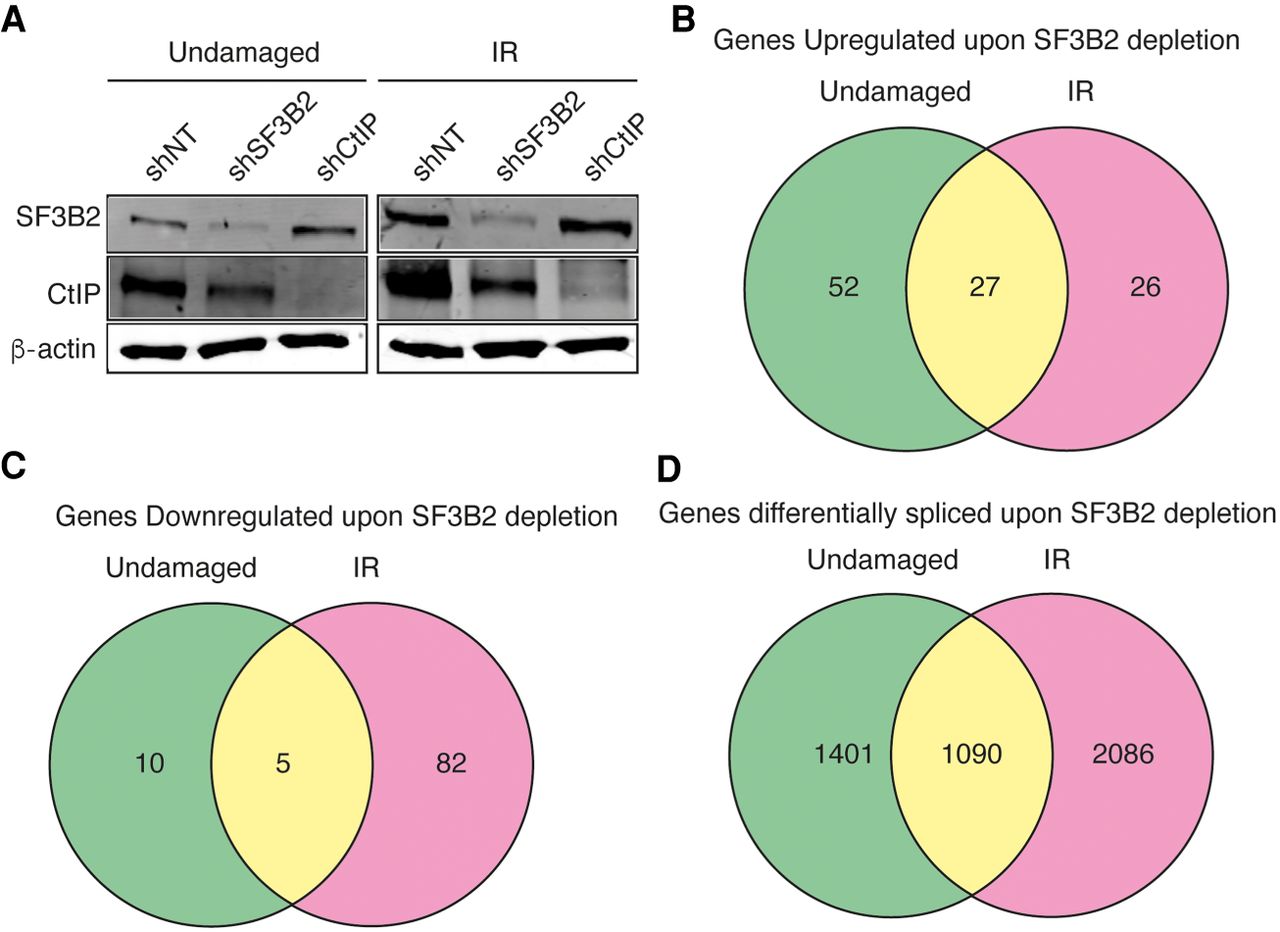
SF3B2 depletion affects gene expression and splicing of many genes. (A) Representative western blot showing the expression levels of SF3B2 and CtIP upon depletion with the indicated shRNAs in cells exposed or not to 10 Gy of ionizing radiation. α-tubulin blot was used as loading control. (B) Distribution of the genes up-regulated upon SF3B2 depletion regarding the exposure or not to DNA damage. Fold change (FC) > 2, P-value < 0.05. Gene expression was measured using the GeneChip HTA Array as described in the Materials and Methods section. The number of up-regulated genes in undamaged cells (green), 6 h after exposure to irradiation (10 Gy; pink) or both (yellow) is shown in a Venn diagram. The actual list of genes can be found in Table 1. (C) Same as A but for down-regulated genes. The actual list of genes can be found in Table 2. (D) The GeneChip HTA Array was used to look for genes that changed their splicing upon SF3B2 depletion, as mentioned in the Materials and Methods section. Other details as in A. The actual list of genes can be found in Supplemental Table 1.




