


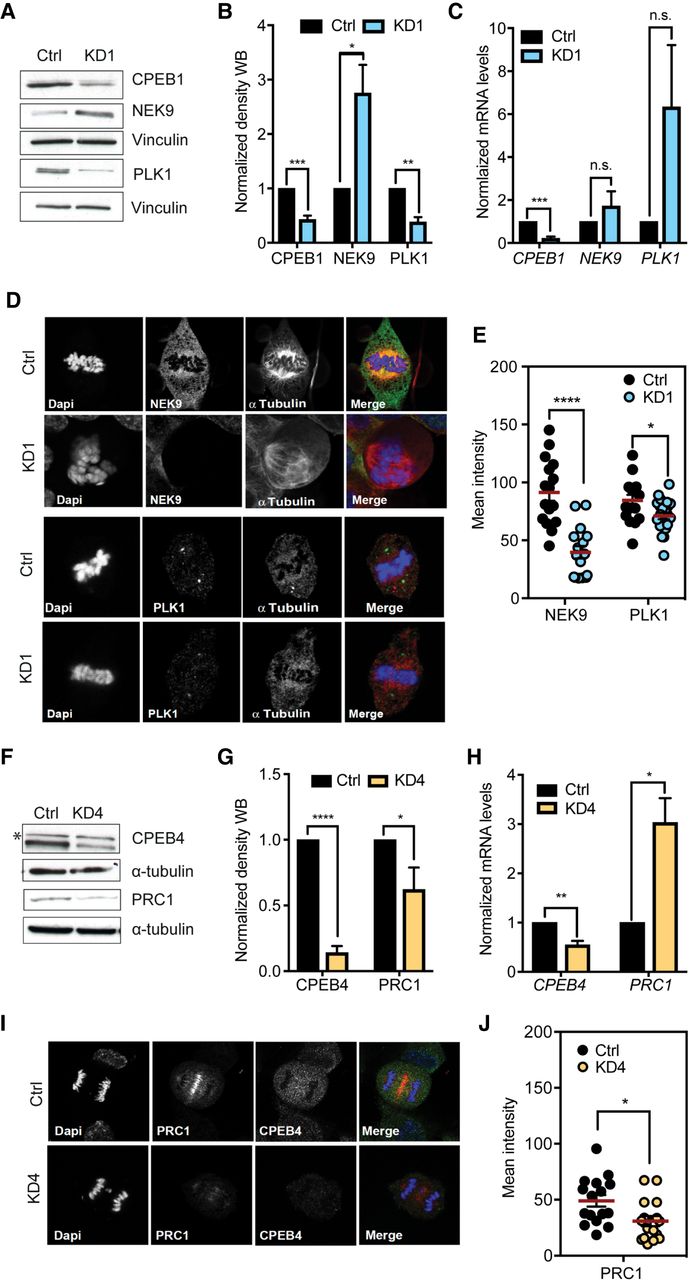
CPEB1 and CPEB4 regulate protein expression of mitotic effectors. (A) Western blot analysis of Nek9 and PLK1 upon CPEB1 knockdown (KD1) in asynchronous hTERT-RPE1 cells. A representative image is shown, with protein quantification (B) and RT-qPCR quantification of mRNA levels in C. (D) Immunofluorescence of the indicated proteins (Nek9 and PLK1) in Ctrl (ShControl) and KD1 (shCPEB1) hTERT-RPE1 cells synchronized in P/M. Quantification of the immunofluorescence is shown in E. (F) Western blot analysis of PCR1 upon CPEB4 knockdown (KD4) in asynchronous hTERT-RPE1 cells. A representative image is shown, with protein quantification (G) and RT-qPCR quantification of mRNA levels in H. (I) Immunofluorescence of the PRC1 in Ctrl and KD4 hTERT-RPE1 cells synchronized in A/T after release from the Cdk1 inhibitor. Quantification of the immunofluorescence is shown in J. Results from three independent experiments. Statistics of immunofluorescence images by Mann–Whitney test (****) P < 0.0001, (**) P < 0.005.




