


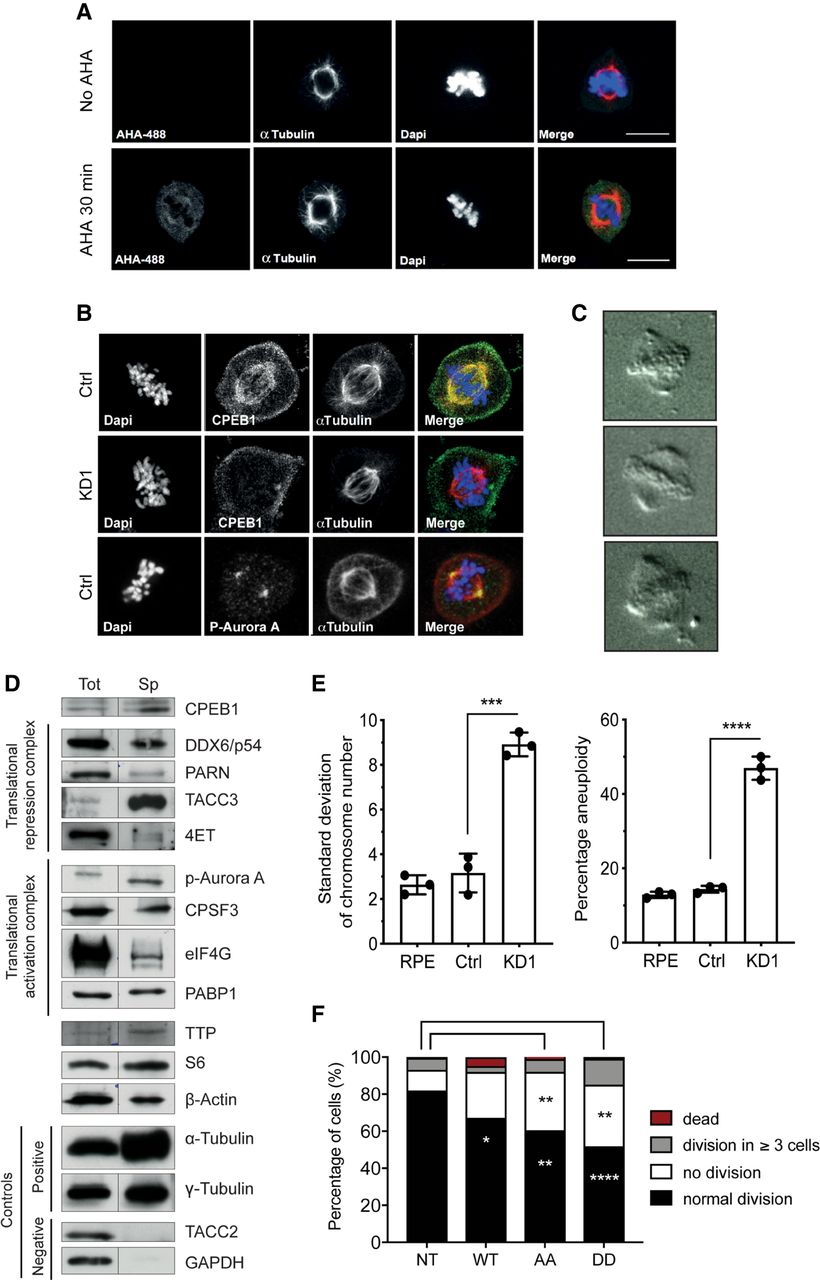
CPEB1 and its cofactors are present in the mitotic spindle. (A) M-phase synchronized hTERT-RPE1 cells not treated or treated with Click-iT AHA (L-azidohomoalanine). Cells were co-stained with DAPI and α-tubulin antibodies to visualize chromosomes and mitotic spindles, respectively. (B) Immunofluorescence images of M-synchronized shCtrl or sh-CPEB1 (KD1) cells, for the indicated proteins and DAPI. (C) Representative images of purified mitotic spindles from metaphasic hTERT-RPE1 cells, 45 min after release from the RO-3306 arrest. (D) Western blot analysis of total cell extracts (Tot) or purified mitotic spindles (Sp) for the indicated proteins. α-tubulin, γ-tubulin, and β-actin were used as positive controls, and TACC2 and GAPDH were used as negative controls, for spindle localized proteins. Note that for most of the proteins analyzed, two nonadjacent gel lanes were cropped and joined. Equal amounts of protein were loaded in “Tot” and “Sp” lanes. (E) Variability in chromosome number (left) and percentage of aneuploidy (right) in RPE1 wild-type (RPE) or infected with shRNAs control (Ctrl) or against CPEB1 (KD1). Data of three independent experiments are shown here (±SD); between 45 and 70 cells were analyzed in each condition. (F) Mitotic outcome (in percentage) classified as cells that normally divided into two daughter cells (Normal division), cells that entered mitosis but could not divide (no division), cells that divided in three or more daughter cells (division in ≥3 cells), and cells that died after entering in mitosis (dead). Conditions correspond to nontransfected cells (NT), cells transfected with wild-type CPEB1 (WT), cells transfected with the nonphosphorylated CPEB1 (AA), or cells transfected with the phosphor-mimetic CPEB1 mutant (DD). Data of three independent experiments are shown here; between 180 and 240 cells were analyzed in each condition. (****) P < 0.0001, (**) P < 0.01, (*) P < 0.05 (two-way ANOVA test).




