


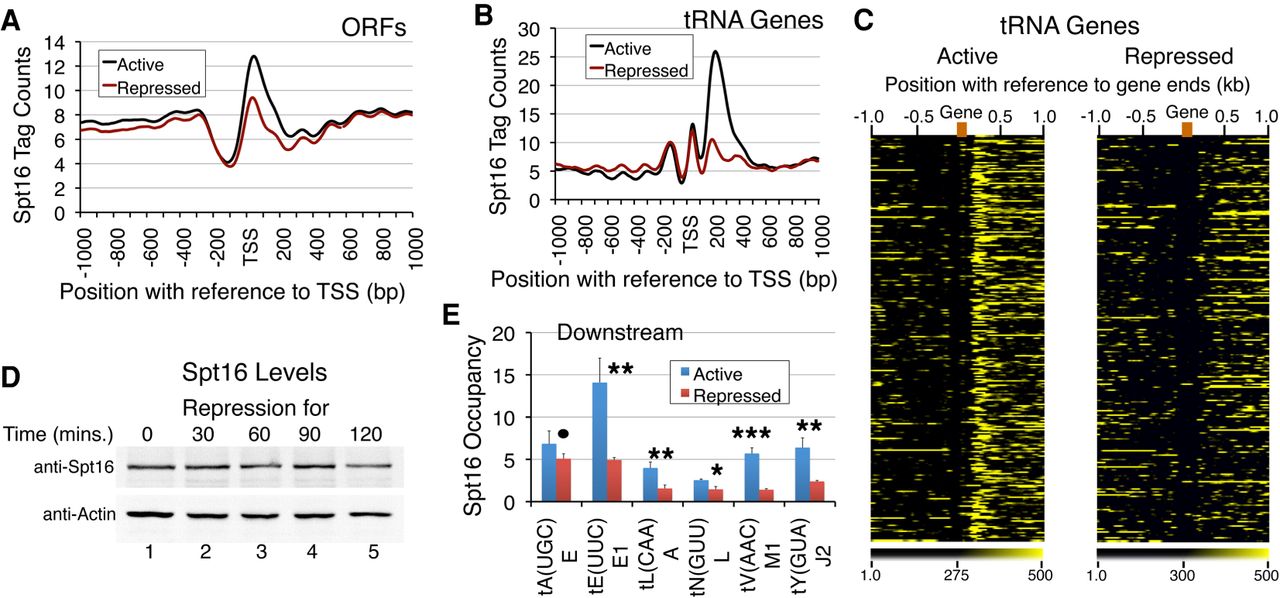
Spt16 is lost from the 3′-end of tRNA genes under nutrient starvation. Spt16 occupancy was measured in the wild-type cells grown under active (normal growth) or repressed (starvation) conditions. (A,B) Average Spt16 tag counts (normalized to per million reads) from our genome-wide ChIP-seq data; all aligned by the TSS are plotted. (A) On the Pol II-transcribed ORFs, reduced Spt16 levels are found near the 5′ gene ends under starvation condition. (B) Comparison of average Spt16 occupancy profiles on the tRNA genes under active and repressed conditions. (C) Heat maps of Spt16 occupancy within 1 kb upstream and downstream from the gene ends on all the tRNA genes (red block). Color gradient code is shown at the bottom. (D) Total protein levels of Spt16 do not change under repression for up to 2 h. TCA precipitated total proteins were resolved by SDS-PAGE, western transferred and probed with anti-Spt16 antibody. Actin was used as a loading control. (E) Relative Spt16–TAP occupancy under active or repressed conditions on some of the tRNA genes, as measured by ChIP and real time PCR. The P-values in order of their appearance on the graph are 0.072805, (**) 0.000743, (**) 0.000979, (*) 0.005788, (***) 0.000016, and (**) 0.000437.




