


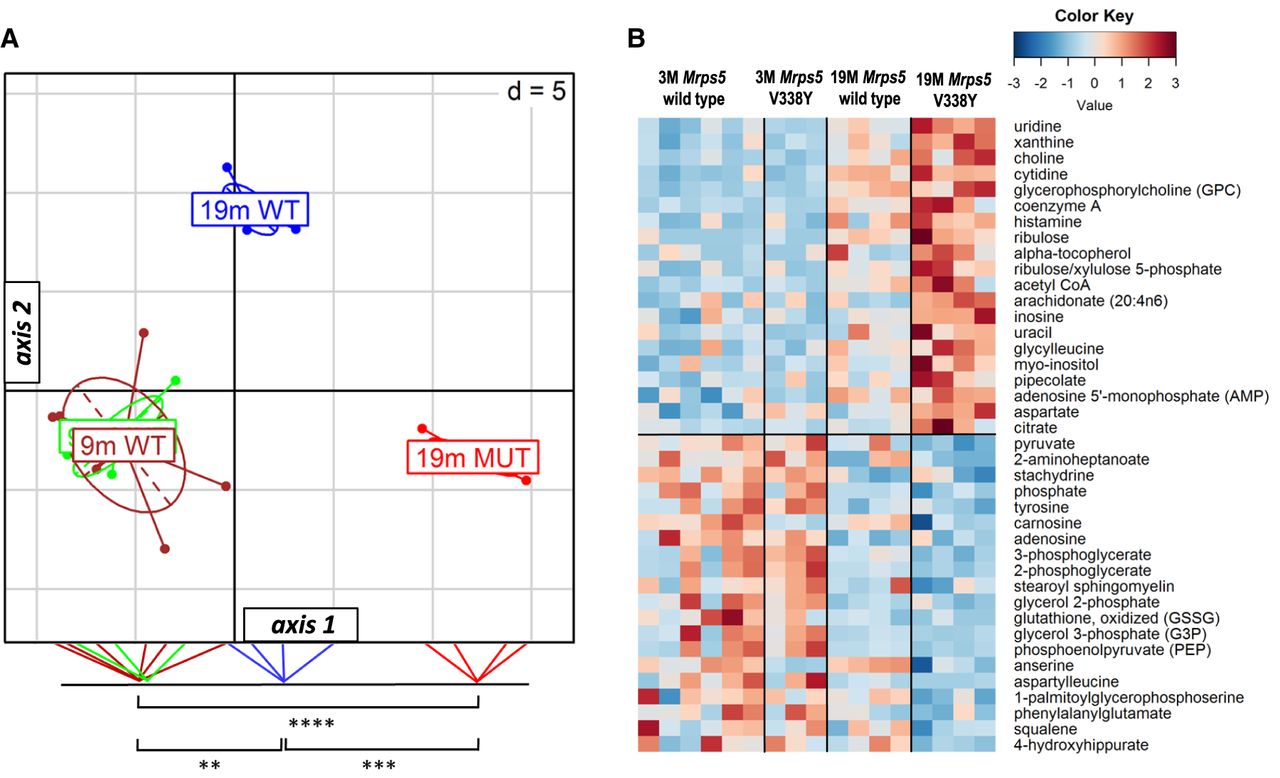
Muscle metabolome analysis. (A) Between group analysis (BGA) scatter plot for muscle metabolite profiles (n = 6 for 9-mo-old Mrps5 WT—green; n = 3 for 9-mo-old Mrps5 V338Y—brown; n = 4 for 19-mo-old Mrps5 WT—blue; n = 4 for 19-mo-old Mrps5 V338Y—red). Coordinates of the animals as well as group centers along axis 1 were projected on the bottom line of the plot frame and significant group differences are indicated (Welch's t-test) (**) P = 0.00081, (***) P = 0.000078, (****) P = 0.000002). (B) Heatmap of the top 20 metabolites positively or negatively correlated with horizontal axis (Student's t-test for 19 mo Mrps5 V338Y mice and 19 mo Mrps5 wild-type animals; P < 0.01 for positively correlated metabolites; P < 0.05 for negatively correlated metabolites).




