


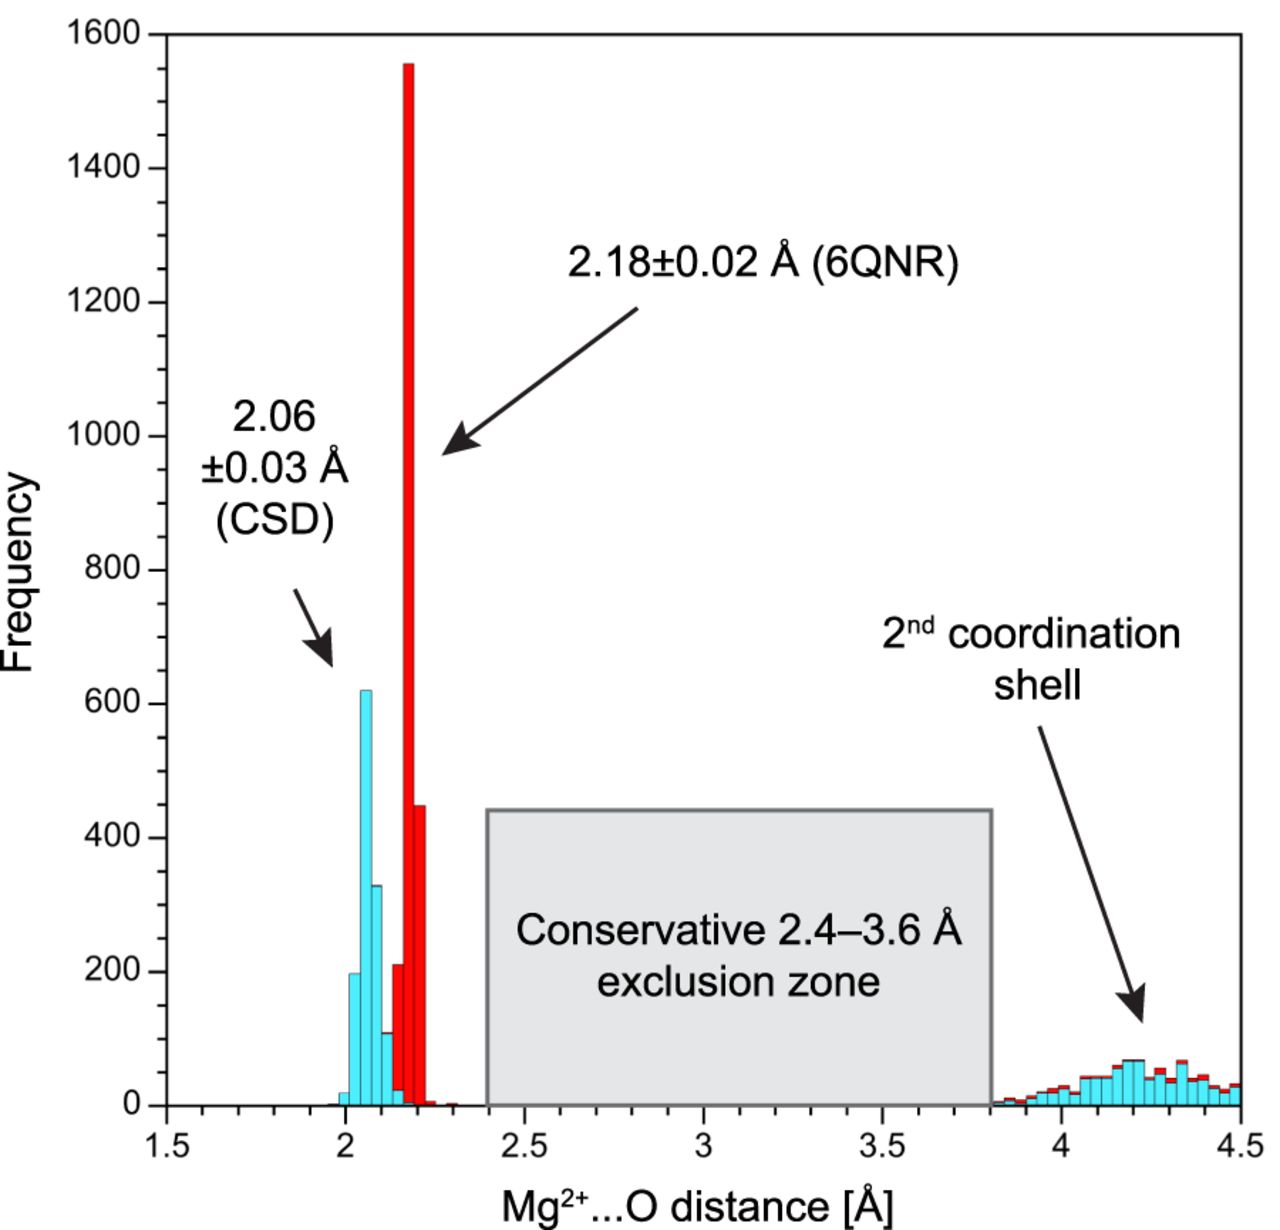
FIGURE 4.
Mg2+…Ow coordination distance bias toward 2.18 Å. The cyan histogram is derived from the CSD (Groom et al. 2016; Taylor and Wood 2019) and is similar to that in Figure 1A. The red histogram highlights the average Mg2+…Ow distance around 2.18 Å in 6QNR (Rozov et al. 2019). The origin of these artifactual distances, strikingly common in PDB structures, have been discussed in previous studies (Zheng et al. 2015, 2017; Leonarski et al. 2017, 2019). For an exclusion zone definition, see Supplemental Table S1 and Supplemental Figure S1.




