


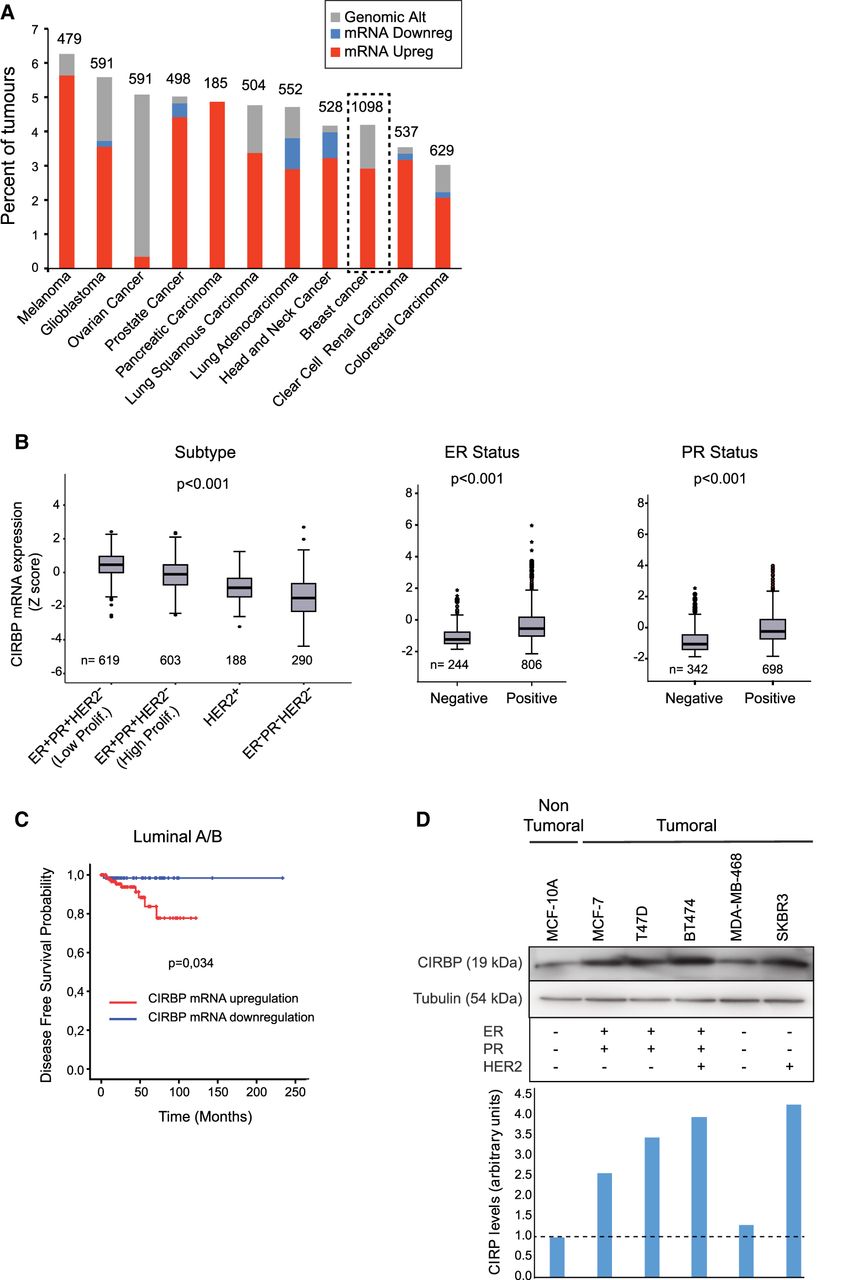
CIRBP is up-regulated in luminal breast cancer and correlates with poor clinical outcome. (A) CIRBP genomic alterations (mutations, deletions, and amplifications) and mRNA transcript levels were evaluated across cancer types using the TCGA database. (B) Expression of CIRBP mRNA across breast cancer subtypes using METABRIC (left panel) and TCGA (middle and right panels) databases. Box-plot center line represents the median, box limits indicate the 25th and 75th percentiles, whiskers extend 1.5 times the interquartile range, and dots represent outliers. Statistics were performed using Kruskal–Wallis (left panel) and Mann–Whitney U (middle and right panels). (C) Kaplan-Meier curve for disease free survival in patients with infiltrating ductal carcinoma of the luminal A/B subtype, and negative lymph node. The optimal cut point was found using the Cut-off Finder script for R. Differences between groups was calculated using log rank test. (D) Western blot analysis of CIRBP levels in breast cancer cell lines. Tubulin is shown as loading control. The molecular markers of these lines are indicated in the chart below. Quantification of the CIRBP signal corrected for tubulin is shown at the bottom.




