


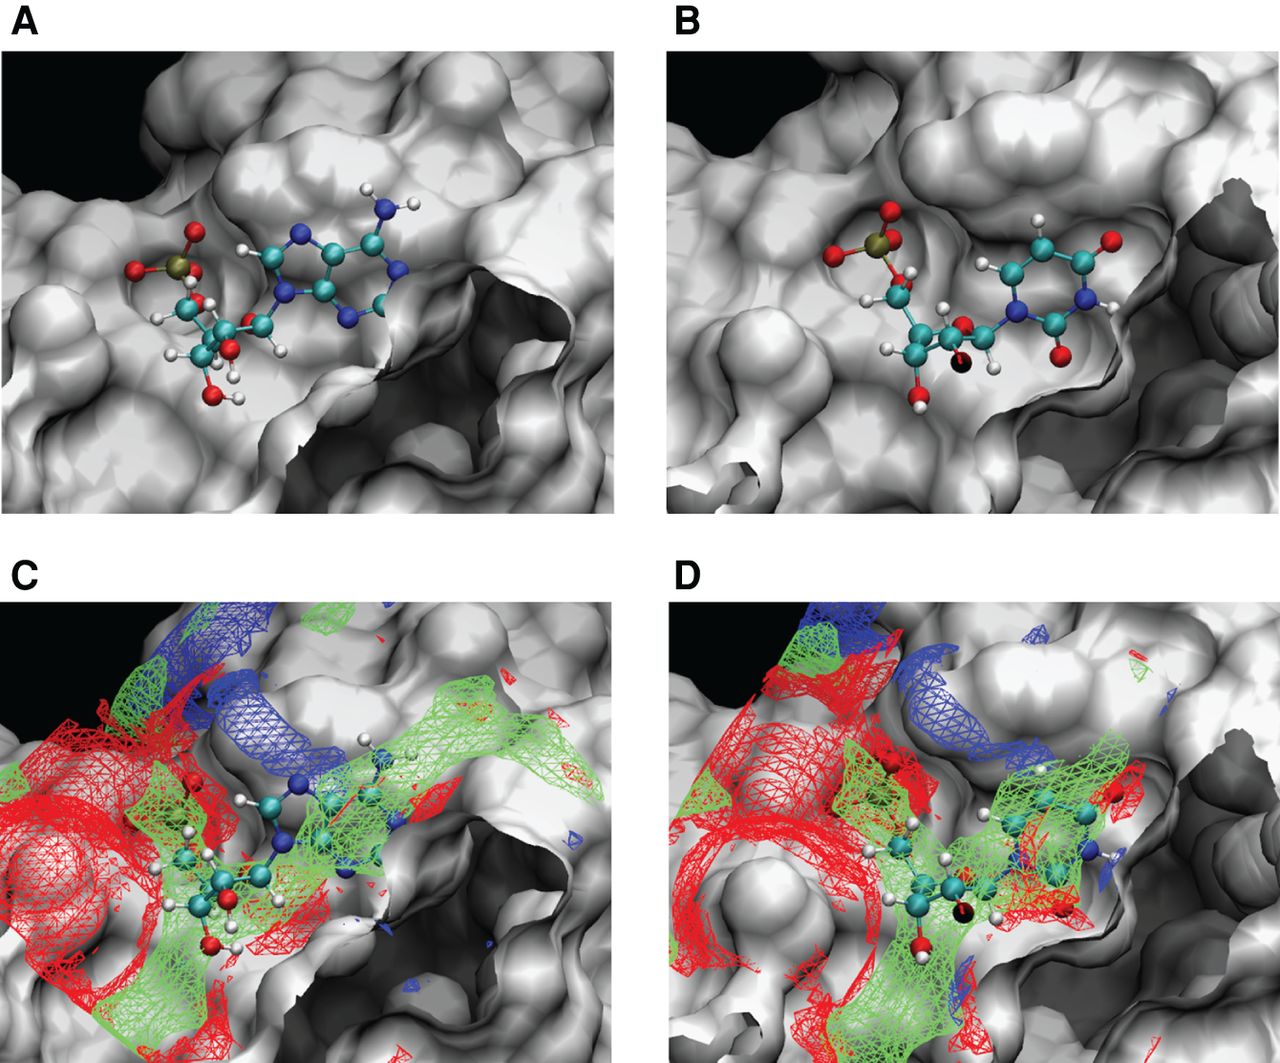
In silico high-probability isosurface analysis of the hydrogen bond acceptor (red mesh), hydrogen bond donor (blue mesh), and hydrophobic moiety (green mesh). (A) AMP-binding pocket. (B) UMP-binding pocket. (C) AMP-binding pocket shown with wireframes. (D) UMP-binding pocket shown with wireframes. To visualize the isosurfaces, a cut-off of −1.5 kcal/mol was implemented for the interaction energy with AGO2. All calculations were performed in the apo form. AMP and UMP are shown to illustrate their respective binding sites in the pockets. AMP and UMP are represented as a ball-and-stick model (hydrogen, white; carbon, aqua; nitrogen, dark blue; oxygen, red; phosphorus, ocher). The molecular surface of AGO2 is shown in white. The figures were prepared using the molecular graphics program VMD (Humphrey et al. 1996).




