


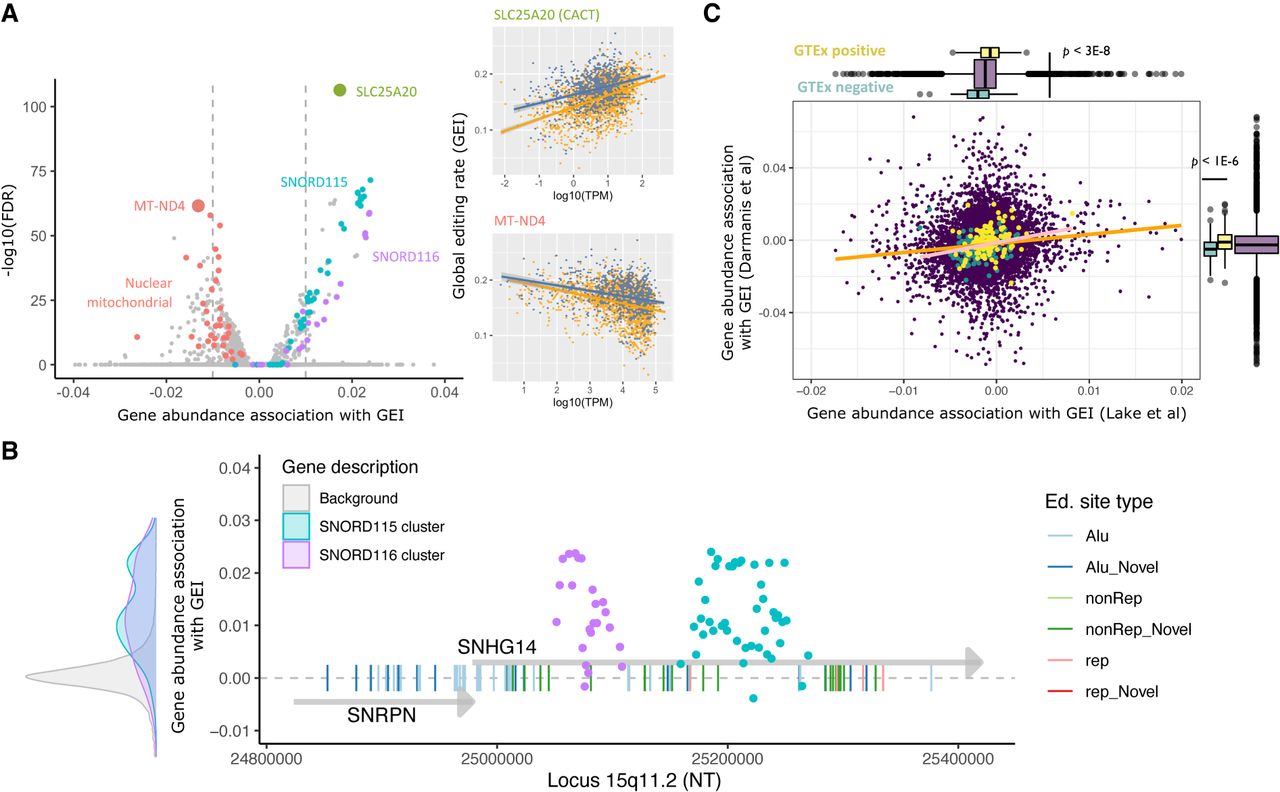
Associations between transcriptional abundance and global RNA editing rates. (A) Associations between gene abundance and the cell-wise global editing index (GEI) (x-axis). The transformed FDR-adjusted P-value of association is represented on the y-axis (higher values are more significant). Correlation plots at right display relationship between global editing index (y-axis) and log10 transcripts per million (x-axis) for neuronal nuclei expressing genes of interest: mitochondrial NADH oxidase 4, and mitochondrial carnitine transporter CACT. (B) Abundance of SNORD115 and -116 snoRNAs in locus 15q11 correlates with global RNA editing rates (y-axis). Genomic location is displayed in nucleotide units on the x-axis. The y-axis displays the effect size of transcriptional association with editing for SNRPN, SNHG14 (gray arrows), and SNORD cluster genes (points). The distribution of correlations between the SNORD clusters and editing is displayed at left relative to all other genes (background) and scaled to the y-axis. Edited sites in SNRPN and SNHG14 are represented by vertical lines, and colored according to genomic context. (C) Correlation between gene abundance-editing associations in ∼15K genes identified in two sNuc-seq data sets. Each purple point represents a gene. Associations between log abundance and global editing in the Lake et al. data set (x-axis) are displayed relative to results from Darmanis et al. data set (y-axis). The orange line indicates fitted correlation between data sets; the pink line indicates correlation between a subset of genes (yellow and green points) identified to have RNA editing associations in GTEx data. Marginal box plots indicate significant separation of positive (yellow) and negative (green) results from GTEx in both sNuc-seq data sets.




