


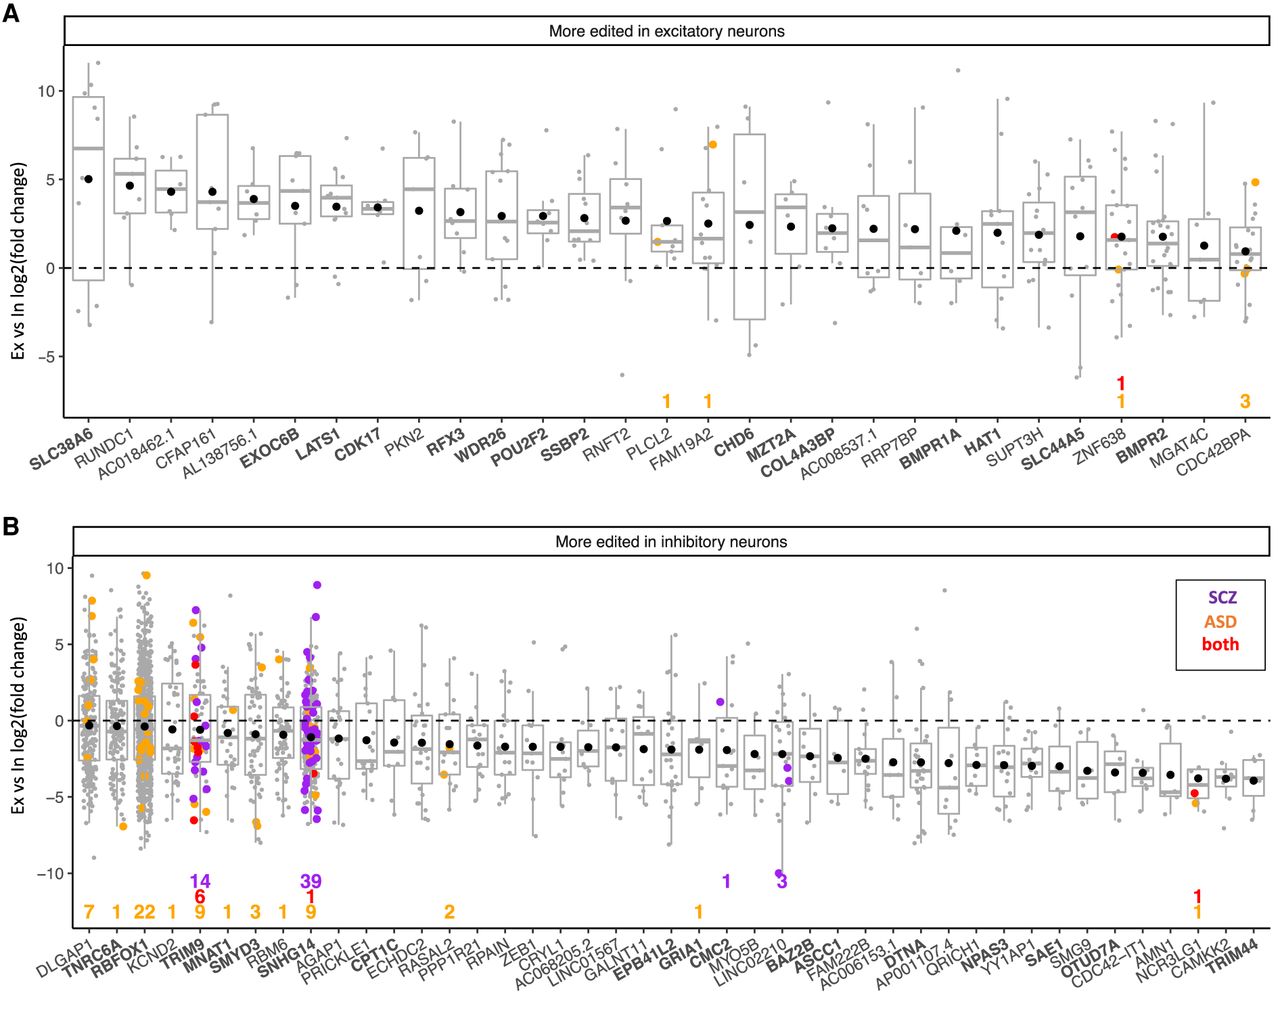
Differential gene editing between excitatory and inhibitory neurons. Genes with preferential editing in excitatory neurons (A) or inhibitory neurons (B). Each point represents log2 fold-change (y-axis) of an edited site in a gene (x-axis). Box plots indicate distribution of the middle 50% of editing fold-changes (box boundaries) and median fold-change (middle line). Black points represent the mean fold-change in editing per gene. Sites differentially edited in cohorts of individuals with schizophrenia (SCZ; purple) or autism spectrum disorder (ASD; orange) or both cohorts (red) are colored accordingly. The relevant number of such sites per gene is displayed numerically at the bottom of the panel. Labels for genes mentioned in the results section are displayed in bold.




