


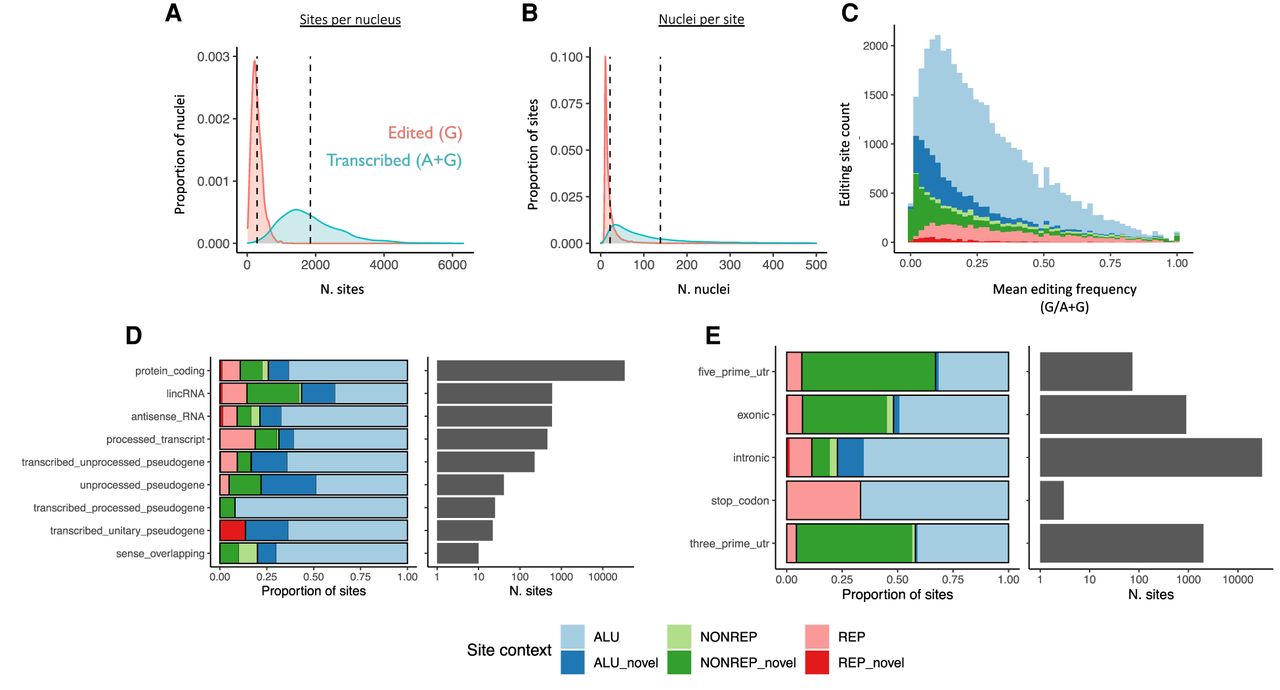
Distribution of 41,930 RNA editing sites across neuronal nuclei, transcriptional frequency, gene biotypes, and features. Density of edited and transcribed (including unedited) sites detected (A) per nucleus (x-axis), and (B) across neuronal nuclei (“nuclei per site” on x-axis). Dashed lines indicate the series mean. (C) Distribution of mean minor (edited) allele frequencies for cataloged (light hues) and novel sites (dark hues) located within Alu repeats (blues); non-Alu repeats (reds) and nonrepetitive sequence (greens). Individual density plots are provided in Supplemental Figure S4b. (D) Distribution of sites colored by site context, across RNA biotypes (y-axis). Number of sites is indicated by bars on right panel, on a log scale. (E) Distribution of protein-coding sites across gene features (y-axis), with number of sites indicated by bars in right panel.




