


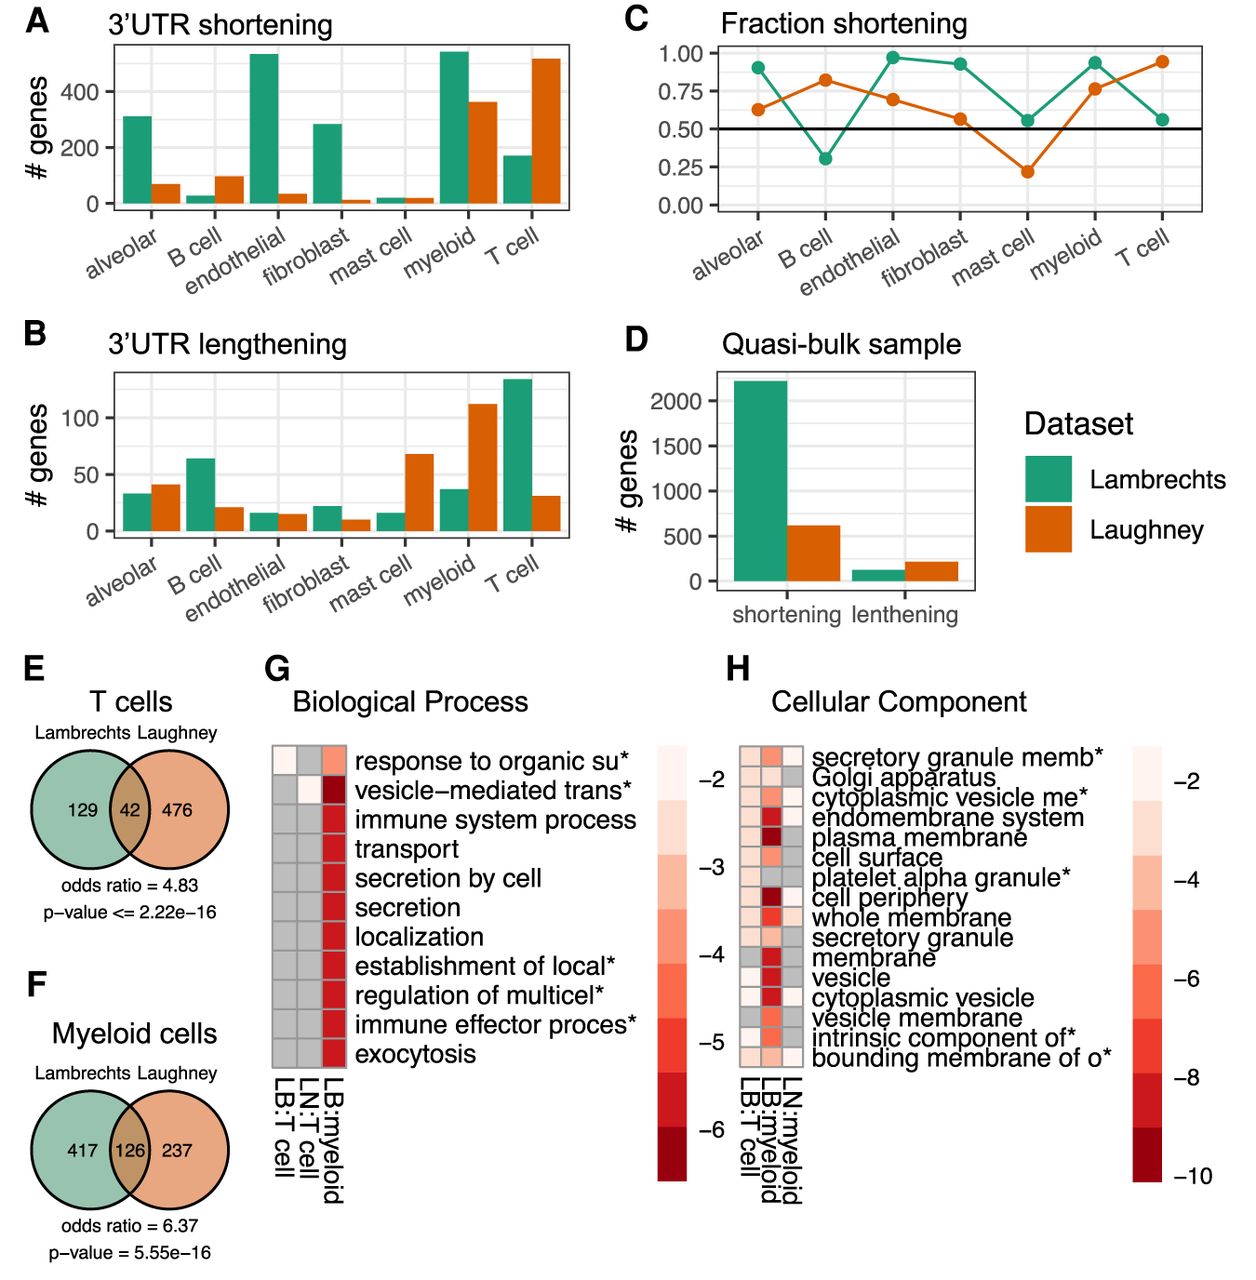
APA events in individual cell types. (A) Number of genes with APA-associated 3′ UTR shortening in the Lambrechts (green) and Laughney (orange) data sets. (B) Number of genes with APA-associated 3′ UTR lengthening, same colors as A. (C) Fraction of 3′ UTR shortening events in individual cell types, among all significant events. (D) Number of genes whose TEs undergo significant length change in quasi-bulk samples, shortening and lengthening events being shown separately. (E) Venn diagram of TE shortening events in T cells from the two studies. Calculation of odds ratio and P-value of overlap with hypergeometric distribution (see Materials and Methods). (F) Similar for myeloid cells. (G) Biological process enrichment for TEs undergoing significant shortening in T cells and myeloid cells from the Lambrechts (LB) and Laughney (LN) studies. No process was specifically enriched in myeloid cells from the Laughney data set. Plot generated with pheatmap (v 1.0.12). (H) Cellular component enrichment for TEs undergoing significant shortening in T cells and myeloid cells from the two studies. No component was specifically enriched in T cells from the Laughney data set. Plot generated as in G.




