


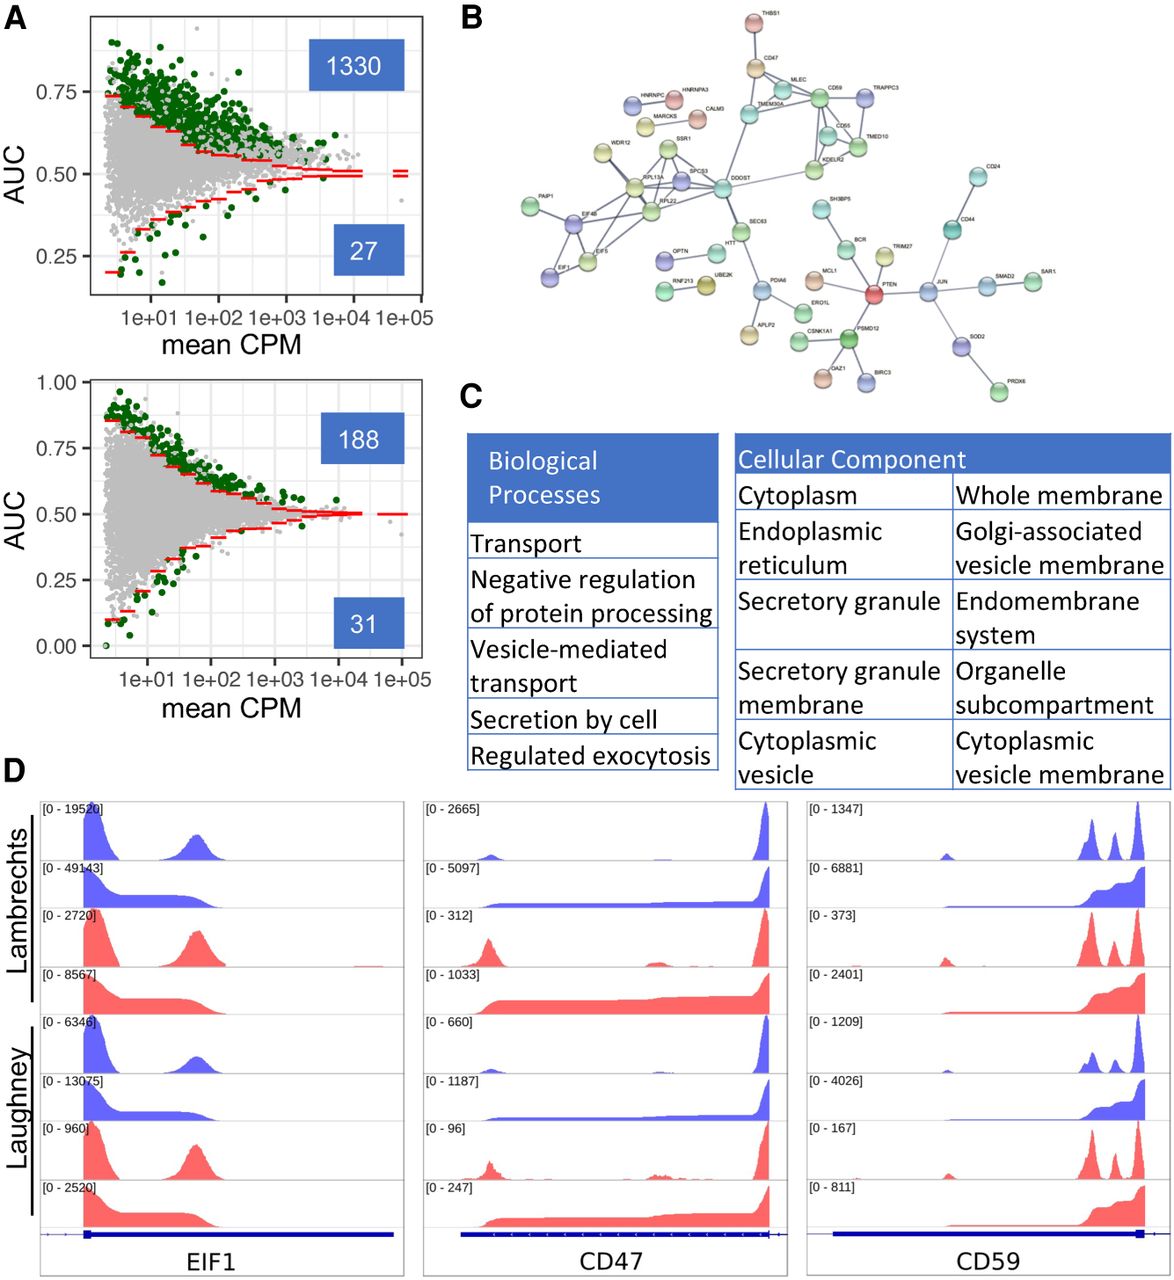
APA in lung adenocarcinoma cells. (A) Scatter plot of AUC in function of log10(mean CPM) for cancer and alveolar cells in the Lambrechts (top) and Laughney (bottom) data sets. TEs with significant APA-induced length changes are highlighted in green (numbers shown in insets). (B) The interaction network (from the STRING web server) of proteins whose transcripts undergo 3′ UTR shortening in both data sets. (C) Functional enrichment analysis for genes whose TEs undergo shortening in cancer cells. Shown are the top 10 GO biological process terms (sorted by the false discovery rate, FDR). Analysis was performed with STRING web server, using as background the set of genes found to be expressed in the lung samples. (D) Read coverage along TEs for a few example genes from panel B (EIF1, CD44, and CD59). Each panel shows four tracks per data set, blue: cancer cells, red: alveolar cells, coverage of the TE by reads (top track) and the cumulative coverage of the TE by read 3′ ends (bottom track). In all cases, the 3′ UTRs are shorter in cancer compared to alveolar cells.




