


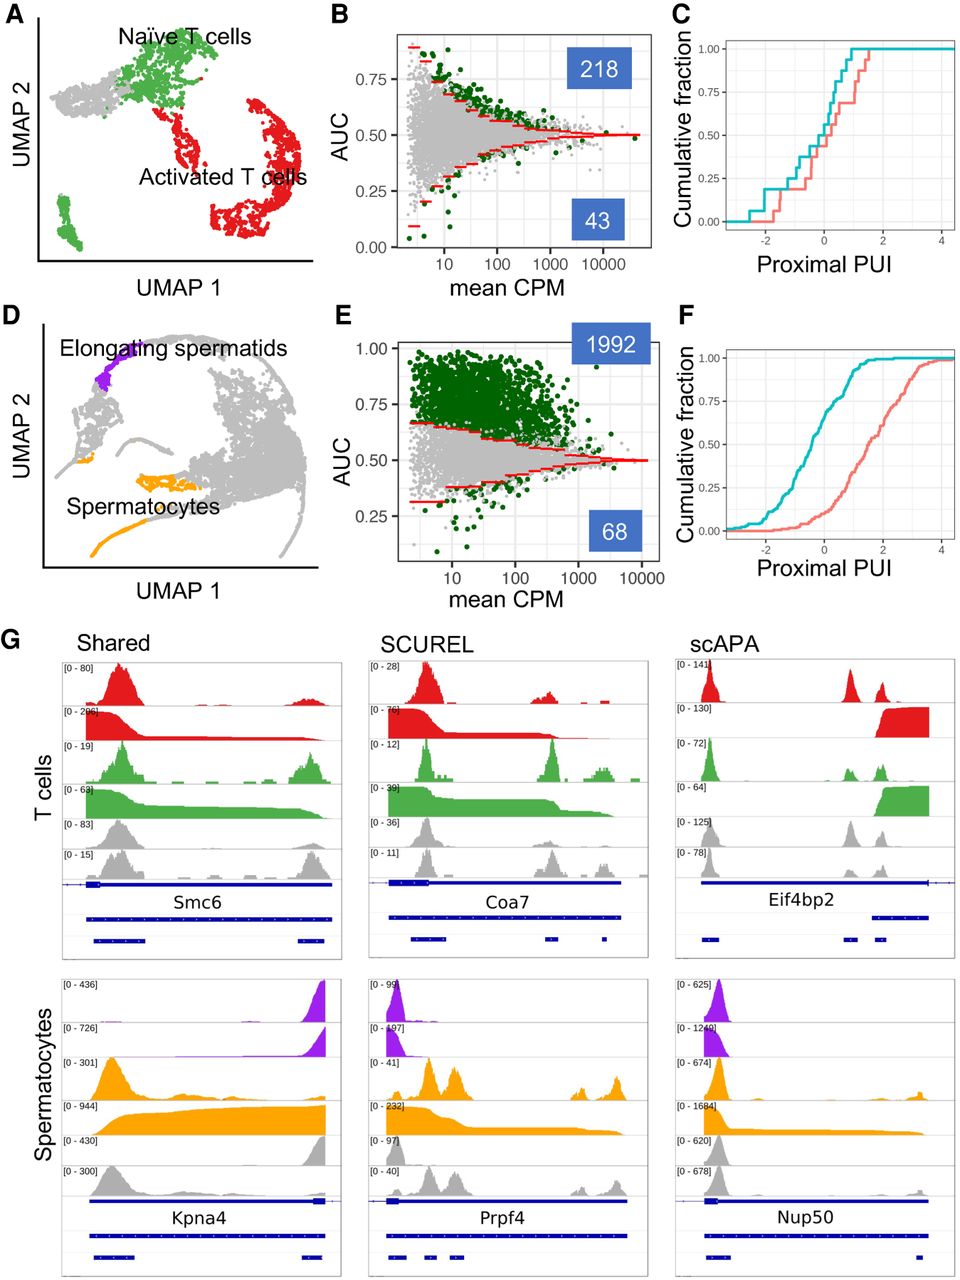
Analysis of APA in T cell activation and spermatogenesis. (A) UMAP projection of the T cell activation data set (Pace et al. 2018) showing activated (red), naive (green), and unassigned (gray) T cells. (B) Scatter plot of AUC in function of log10(mean CPM) for 9099 TEs. The 1% quantiles (red lines) of the distributions obtained from the randomized data set were used to identify TEs whose length changed significantly. AUC values >0.5 indicate shorter 3′ UTRs in activated T cells. TEs whose length changes were attributed to APA based on the span of the read 3′ ends (see Materials and Methods) are shown in green. (C) Cumulative distribution of proximal peak usage index (proximal PUI) for genes deemed by scAPA to undergo significant 3′ UTR length changes. Activated T cells (red) generally have higher proximal PUI compared to naive T cells (blue), indicating 3′ UTR shortening in activated T cells. (D) UMAP projection of the spermatogenesis data set (Lukassen et al. 2018), with highlighted elongating spermatids (purple) and spermatocytes (orange). (E) Scatter plot of AUC in function of log10(mean CPM) for 7875 TEs (see panel B for details). AUC values >0.5 indicate longer 3′ UTRs in spermatocytes. (F) As in C, but comparing elongating spermatids (red) with spermatocytes (blue). (G) Examples of genes deemed to exhibit significant change in 3′ UTR length by both methods (left), by SCUREL only (middle), or by scAPA only (right). For each example, the tracks are as follows: read coverage and cumulative distribution in the two conditions (activated—red—and resting—green—T cells for T cell examples, elongating spermatids—purple—and spermatocytes—orange—for the spermatogenesis examples), followed by coverage tracks from scAPA for the same two conditions in gray. The three blue tracks on the bottom denote in order, the Refseq annotation of the gene, the TE region analyzed in SCUREL, and the peaks identified by scAPA.




