


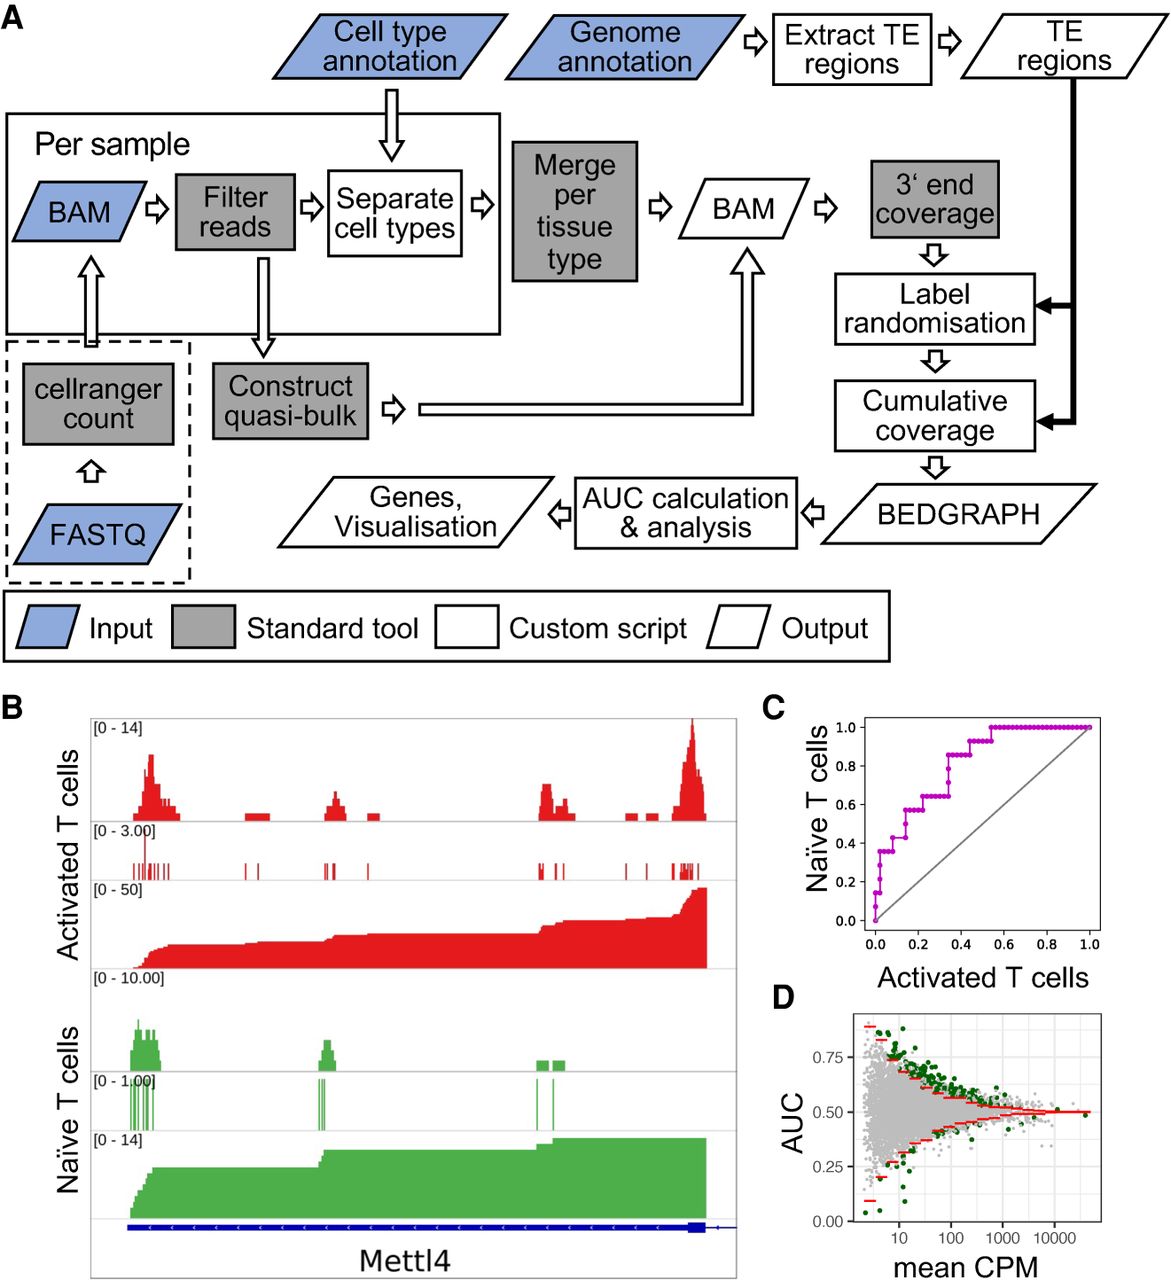
Overview of SCUREL. (A) Schematic representation of the workflow for detecting significant changes in 3′ UTR length between two cell populations. Input data (blue) consist of mapped reads from cellranger count and a table of annotated cell barcodes. The genome annotation is used to extract TEs, their cumulative 3′ end coverage in the two cell groups yielding the AUC value, which we used as a measure of APA. Dashed box: Alternative start of the workflow, from scRNA-seq reads in FASTQ format. The cell-type annotation is done semiautomatically, based on marker gene expression (see Materials and Methods). (B) Cumulative 3′ end coverage of the TE of mouse Mettl4 gene in activated (red) and naive (green) T cells from the Pace et al. (2018) study. For each cell type, the first track shows the read coverage along the TE, the second track the location of read 3′ ends and the third track the reverse cumulative of the 3′ end coverage. The gene is on the negative strand of the chromosome. (C) Summary of the cumulative 3′ end read distribution along the TE of Mettl4 in activated versus naive T cells, from the 3′ (at 0,0) to the 5′ (at 1,1) end. Points correspond to individual nucleotides of the TE where 3′ end reads are observed. The upwards deviation of the curve relative to the diagonal line indicates higher coverage of the distal region of the TE in naive T cells, quantified by the AUC value of 0.582. (D) Distribution of AUC values as a function of log10(mean CPM) per TE in the mouse T cell activation data set (Pace et al. 2018). A total of 9099 TEs are represented, 218 showing significant shortening and 43 TEs significant lengthening (green points) attributed to APA.




