


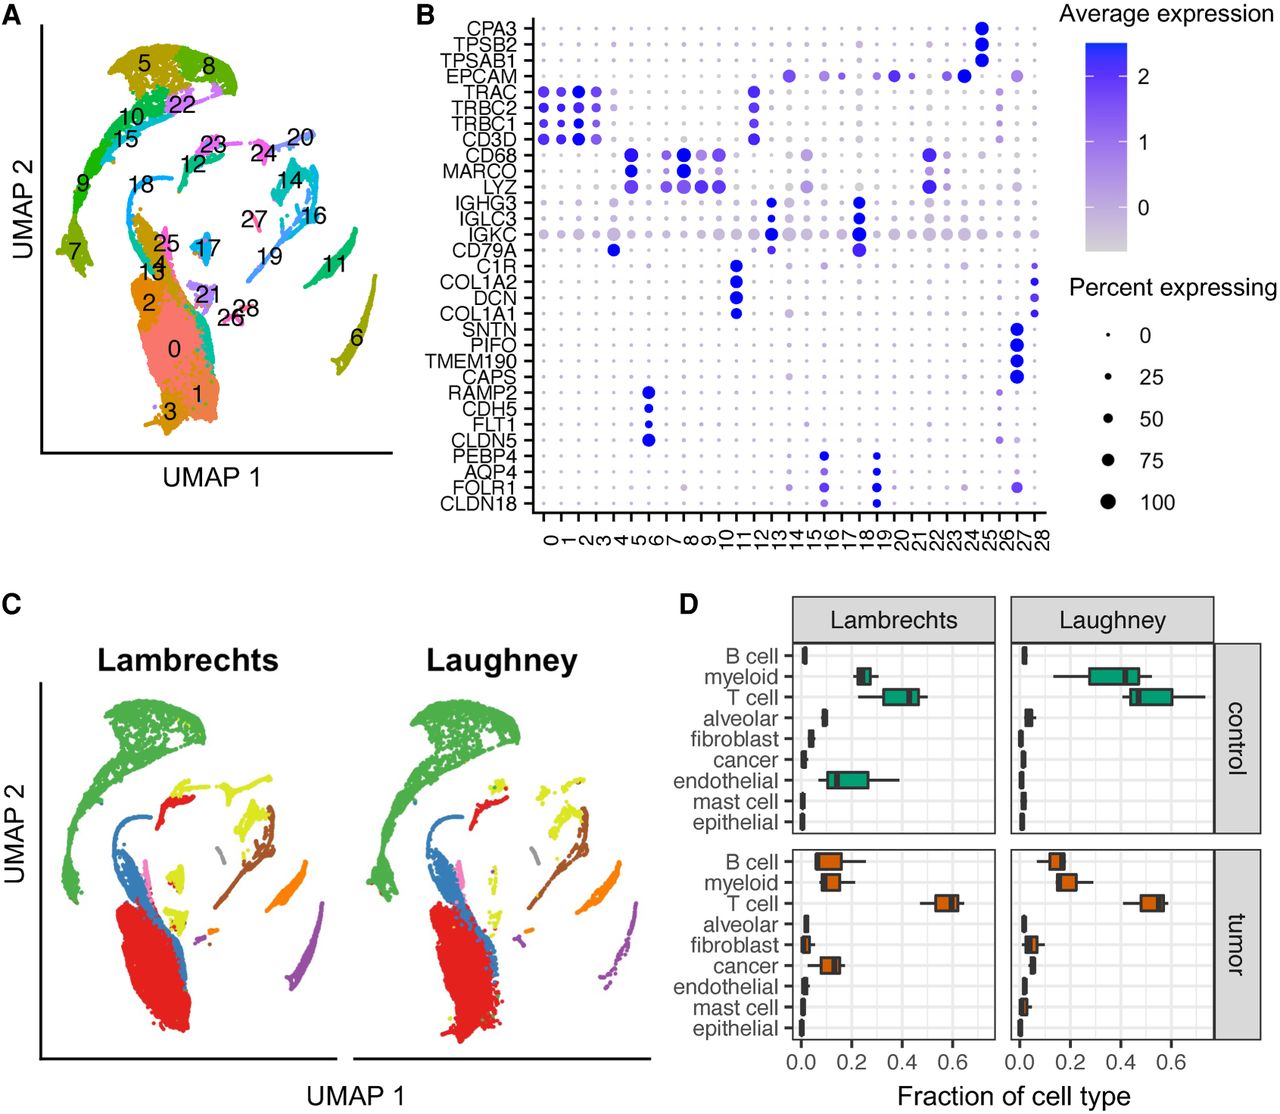
Cell-type composition of lung adenocarcinoma and matched control samples. (A) Two-dimensional projection (Uniform Manifold Approximation and Projection, UMAP) of gene expression vectors. The projections were obtained with the RunUMAP function from Seurat v3.2.3 (Butler et al. 2018), based on the first 10 principal components. The two data sets were integrated with harmony. Cell clustering was done on the shared nearest neighbor (SNN) graph (see Materials and Methods). (B) Dot plot of marker gene expression across the clusters shown in panel A. Shown is the average expression and percent of expressing cells per cluster for the markers used in Lambrechts et al. (2018) (see also Table 1). The dot plot was created with Seurat. (C) Two-dimensional projection (created with Seurat) of gene expression vectors as in A, but highlighting only cells from one study in each panel. (D) Box plot of relative proportion of each cell type in control (green) and tumor (red) samples from individual patients from the Lambrechts and Laughney data sets.




