


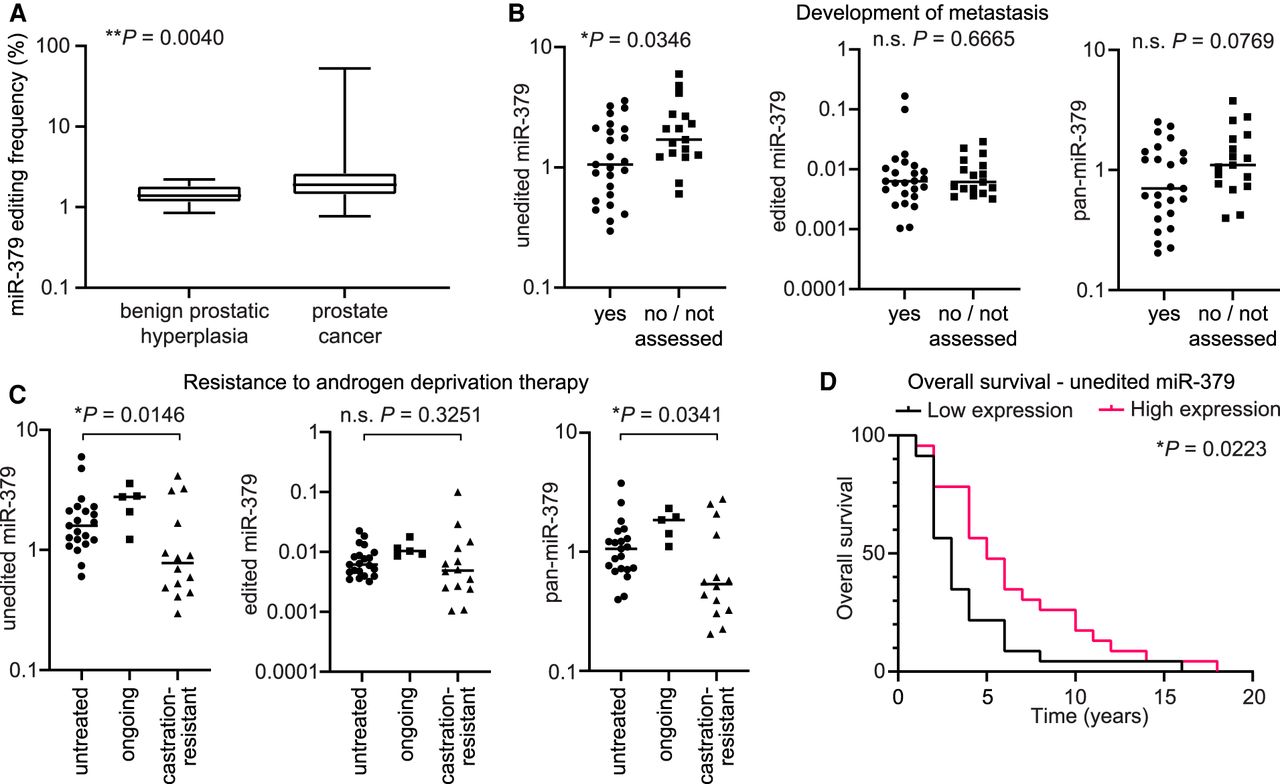
Deregulation of miR-379 editing and specific miR-379 isoforms in a prostate cancer cohort. (A) Editing frequency of miR-379 in 23 BPH and 47 PC patients. Editing frequencies were calculated based on the absolute number of edited miR-379 molecules divided by the sum of unedited and edited miR-379 molecules. Absolute numbers were derived from standard curves of serially diluted RNA oligonucleotides. Box plot marks the median and upper and lower quartiles, whiskers denote the range of values. Exact P-value was calculated using Mann‐Whitney U-test. (B) Comparison of relative expression of unedited miR-379 (left), edited miR-379 (middle), and pan-miR-379 (right) in PC patients that developed metastasis (n = 25) and those that did not get metastases or in which metastasis was not suspected and therefore not assessed (n = 17). Expression was normalized to the geometric mean of U47, RNU48, and RNU66. Individual values and the median are shown. Exact P-values were calculated using Mann‐Whitney U-tests. (n.s.) Not significant. (C) Comparison of relative expression of unedited miR-379 (left), edited miR-379 (middle), and pan-miR-379 (right) in hormone-naïve PC patients (n = 21), those that were currently undergoing hormone treatment (n = 5), and those with castration-resistant PC (n = 14). Expression was normalized to the geometric mean of U47, RNU48, and RNU66. Individual values and the median are shown. Exact P-values were calculated using Mann‐Whitney U-tests. (n.s.) Not significant. (D) Survival analysis of patients with high or low relative expression of unedited miR-379. Patients were sorted by unedited miR-379 expression and divided into two groups at the median (n = 23 in each group). The P-value was calculated using log-rank test.




