


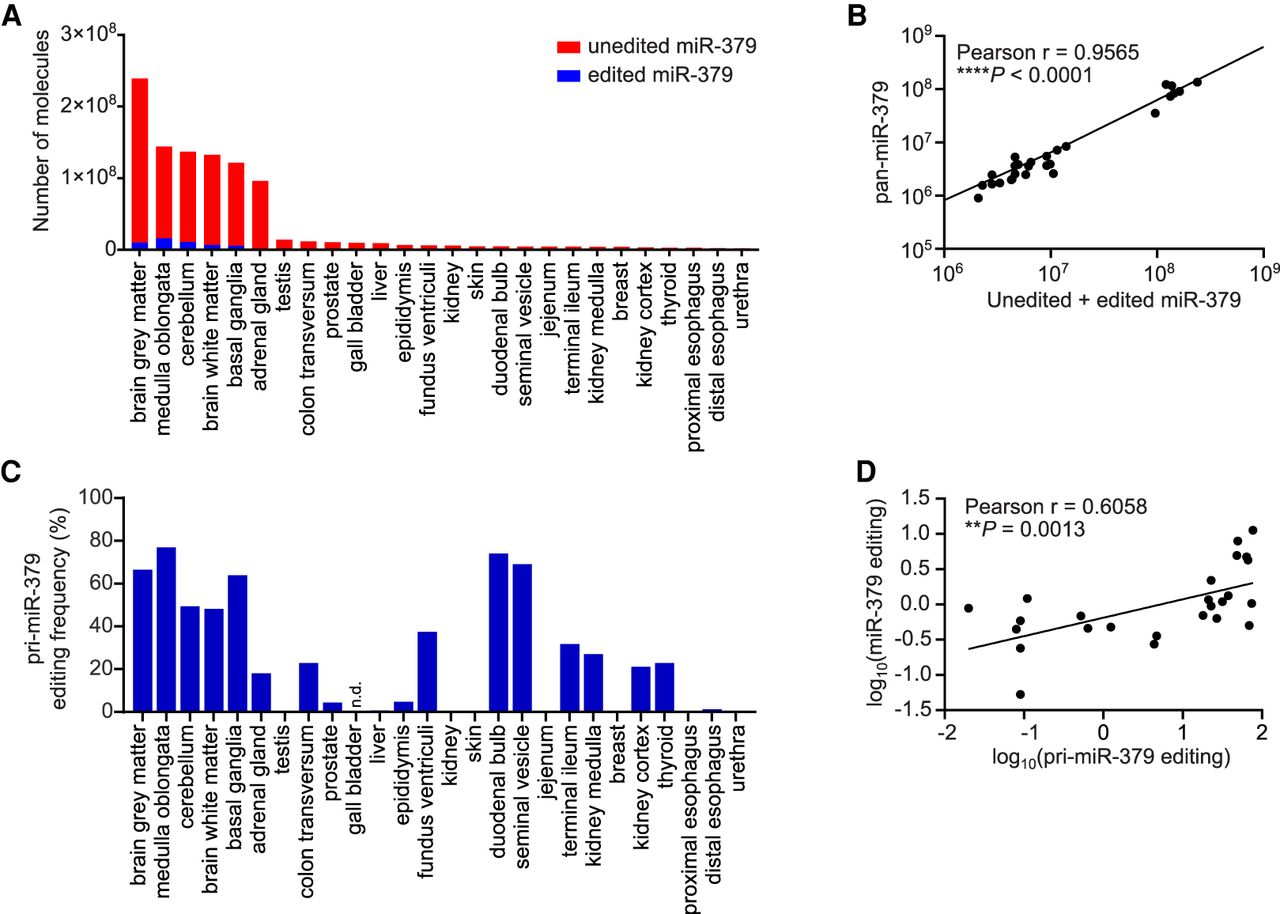
Expression and editing levels of miR-379 in a range of human tissues. (A) Number of molecules of unedited (red) and edited (blue) miR-379 in human tissues as determined by editing-specific two-tailed RT-qPCR. Absolute numbers were derived from standard curves of serially diluted RNA oligonucleotides, and normalized using the geometric mean of RNU24, RNU44, RNU48, and RNU66. (B) Correlation between the sum of unedited and edited miR-379 molecules and pan-miR-379 molecules. Absolute numbers were derived from standard curves of serially diluted RNA oligonucleotides. The P-value was calculated by linear regression and Pearson correlation. (C) Editing frequencies of pri-miR-379 in a range of human tissues as determined by RT-PCR and Sanger sequencing. From gall bladder cDNA, pri-miR-379 could not be successfully PCR-amplified. (n.d.) Not detected. (D) Correlation between editing frequencies of mature miR-379 and pri-miR-379 in human tissues. Variables were log-transformed to enable meaningful linear regression and Pearson correlation.




