


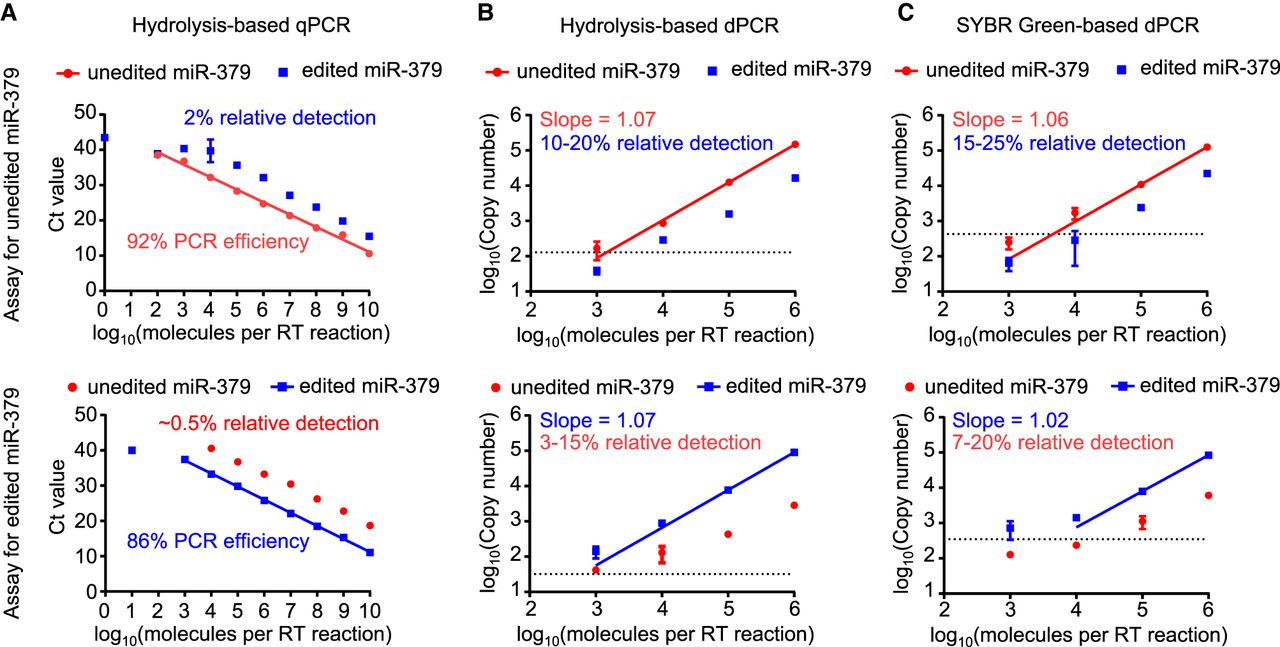
(A) Ct values for different dilutions of unedited (red circles) and edited (blue squares) miR-379 RNA oligonucleotides using hydrolysis probe-based qPCR for unedited (top) and edited (bottom) miR-379. Plots are representative of three independent experiments. Error bars denote the standard deviation of technical replicates; for points without error bars, the standard deviation was too small to be plotted. PCR efficiencies were calculated based on the slope. The average relative detection rate of non-target miR-379 was calculated based on the Ct difference to target miR-379. (B,C) Different dilutions of unedited (red circles) and edited (blue squares) miR-379 RNA oligonucleotides quantified by hydrolysis probe-based dPCR (B) and (C) SYBR Green-based dPCR for unedited (top) and edited (bottom) miR-379. Plots are representative of two independent experiments. Error bars denote the standard deviation of technical replicates; for points without error bars, the standard deviation was too small to be plotted. The dotted line marks the background, that is, the estimated “copy number” for negative control samples.




