


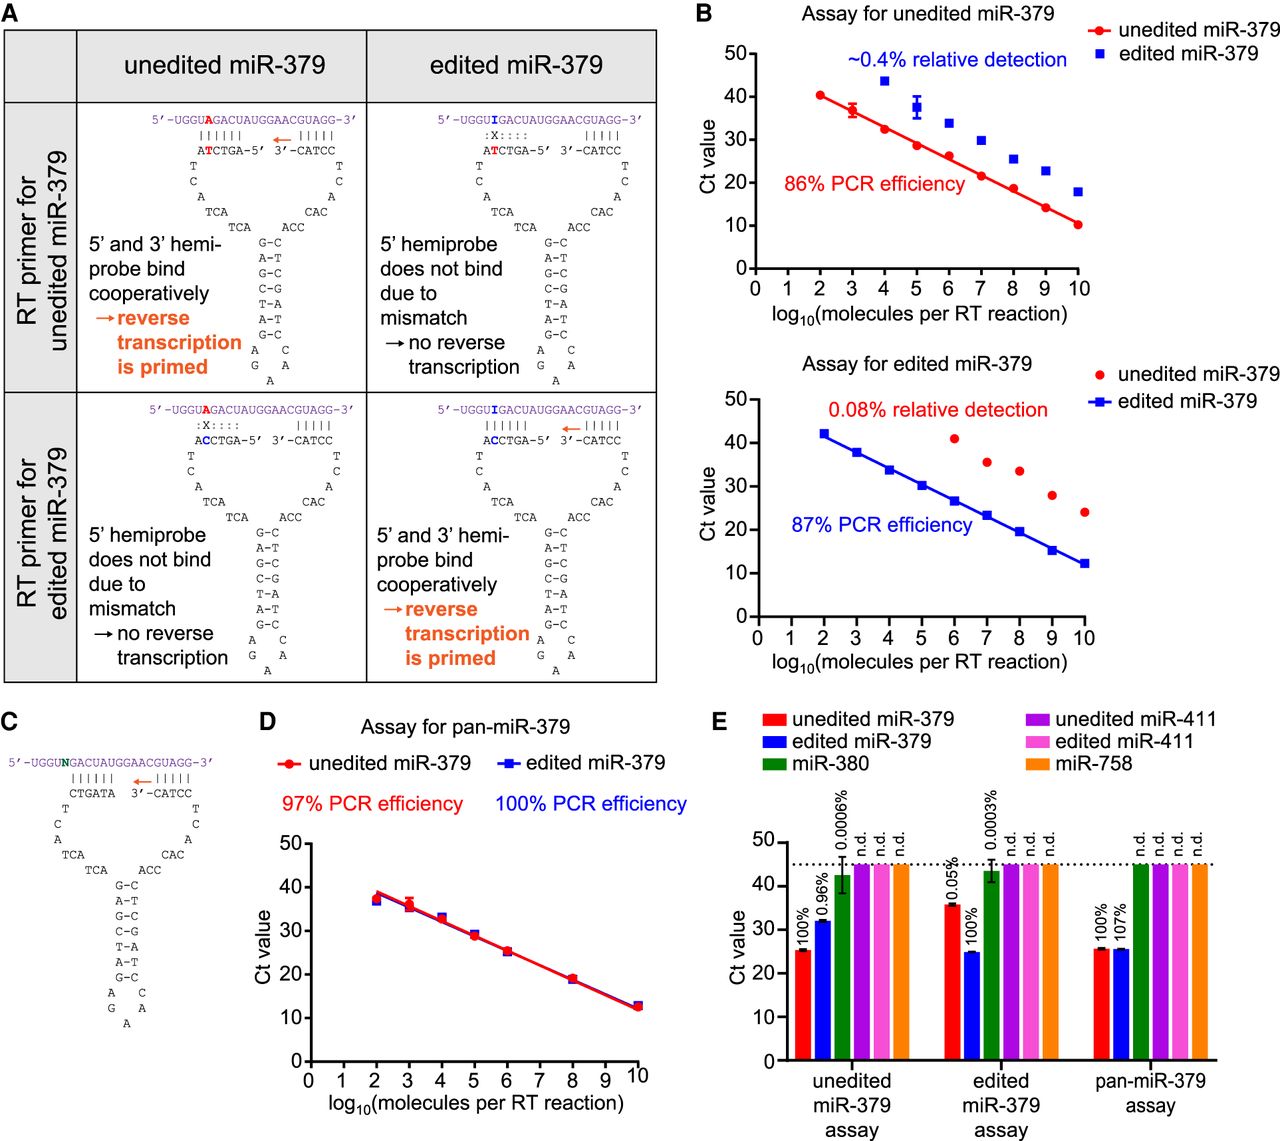
Two-tailed RT-qPCR assays for unedited, edited, or pan-miR-379. (A) Principle of RT primer design for editing-sensitive miR-379 assays. The 5′ hemiprobe is designed to only bind one of the two editing isoforms. Reverse transcription is only primed when both hemiprobes can bind with high affinity. (B) Ct values for different dilutions of unedited (red circles) and edited (blue squares) miR-379 RNA oligonucleotides quantified by the two-tailed RT-qPCR assays specific for unedited miR-379 (top) and edited miR-379 (bottom). Plots are representative of at least three independent experiments. Error bars denote the standard deviation of technical replicates; for points without error bars, the standard deviation was too small to be plotted. PCR efficiencies were calculated based on the slope. The average relative detection rate of non-target miR-379 was calculated based on the Ct difference to target miR-379. (C) RT primer design for the pan-miR-379 assay. The 5′ hemiprobe binds a part of the miRNA that is not subject to editing. (D) Ct values for different dilutions of unedited (red circles) and edited (blue squares) miR-379 RNA oligonucleotides quantified by the pan-miR-379 RT-qPCR assay. The plot is representative of at least three independent experiments. Error bars denote the standard deviation of technical replicates; for points without error bars, the standard deviation was too small to be plotted. PCR efficiencies were calculated based on the slope. (E) Ct values for 106 molecules of different miR-379 family members by the three two-tailed RT-qPCR assays. The plot is representative of two independent experiments. Error bars denote the standard deviation of technical replicates. Numbers above the bars indicate the relative detection of each miRNA compared to the detection of the assay's target (100%). The dotted line marks the maximum number of Ct cycles (45 cycles). Any samples that did not show amplification at a Ct lower than this are considered undetectable. (n.d.) Not detected.




