


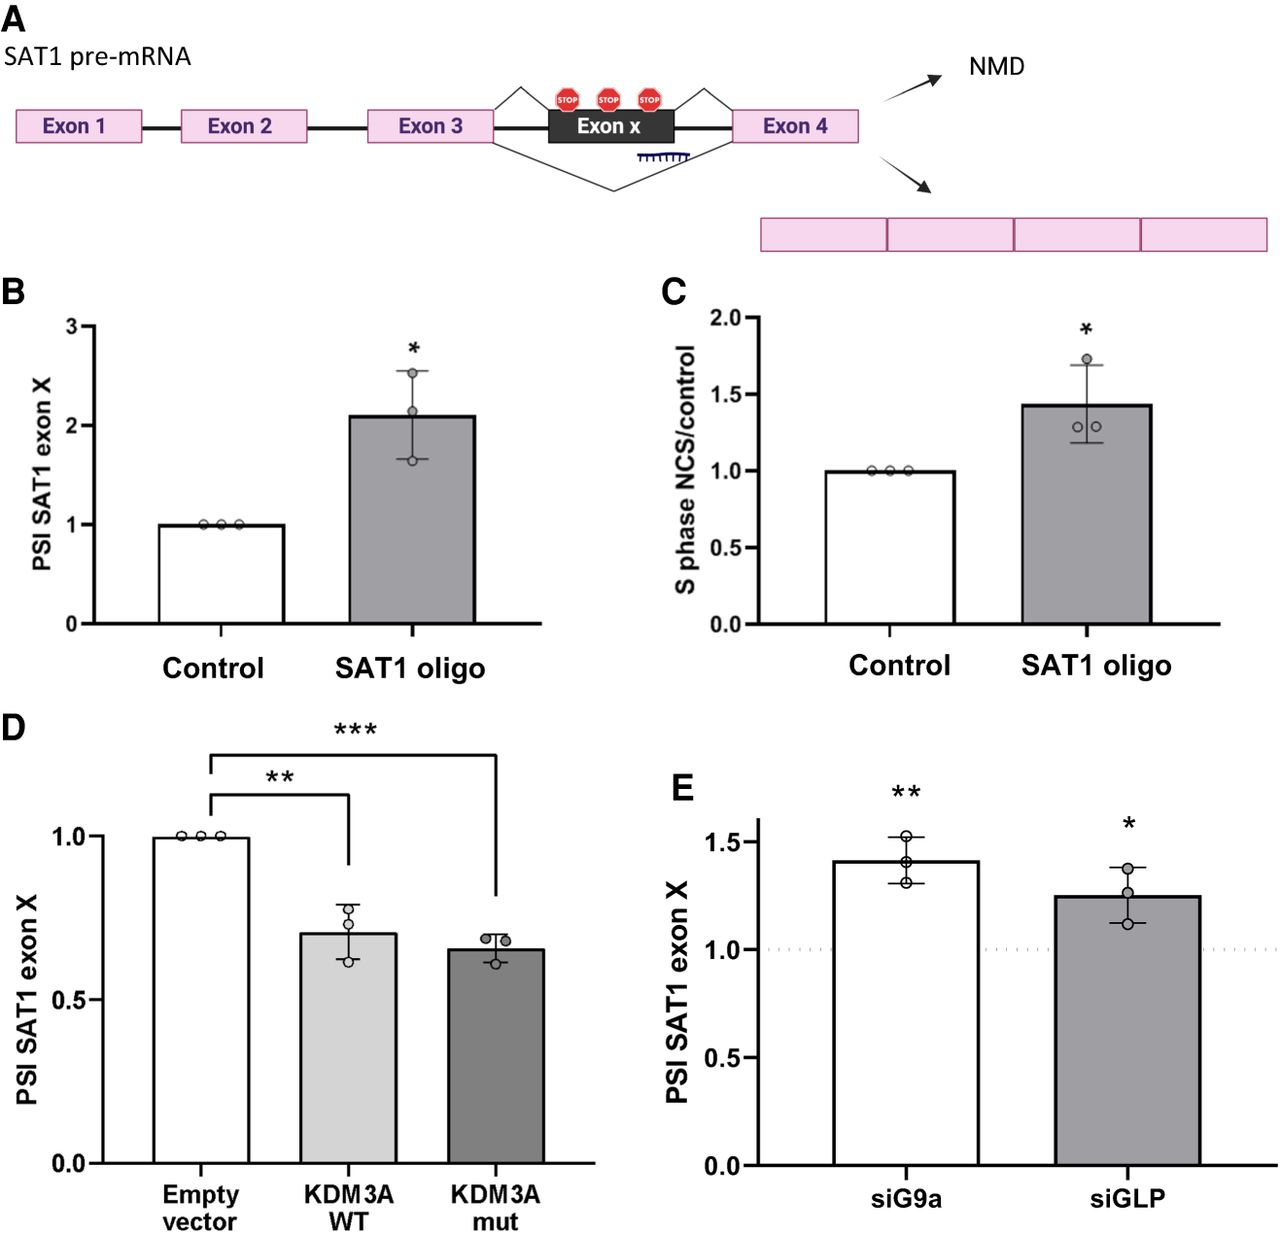
KDM3A regulates SAT1 alternative splicing independent of its demethylase enzymatic activity. (A) Schematic representation of SAT1 alternative splicing. Rectangles: exons, black lines: introns. (B,C) MCF7 cells were mock transfected or transfected with 1 µM SAT1 oligo for 72 h, total RNA was extracted and analyzed by real-time PCR for SAT1 exon X inclusion. PSI was calculated by SAT1 exon X relative to SAT1 total mRNA amount (B), and the cells were treated with 200 ng/mL NCS, and analyzed 8 h later using flow cytometry. The amount of cells accumulated in S-phase is shown as a fold-change relative to untreated cells (C). (D) MCF7 cells stably expressing either the empty vector, wild-type KDM3A or KDM3A mutated demethylase (mut). Total RNA was extracted and analyzed by real-time PCR for SAT1 exon X inclusion. PSI was calculated by SAT1 exon X relative to SAT1 total mRNA amount. (E) MCF7 cells were transfected with nontargeting siRNA (siNT) and siG9a or siGLP for 72 h. Total RNA was extracted and analyzed by real-time PCR for SAT1 exon X inclusion. PSI was calculated by SAT1 exon X relative to SAT1 total mRNA amount. Values represent averages of three independent experiments ± SD. (*) P < 0.05; (**) P < 0.01; (***) P < 0.001; (****) P < 0.0001.




