


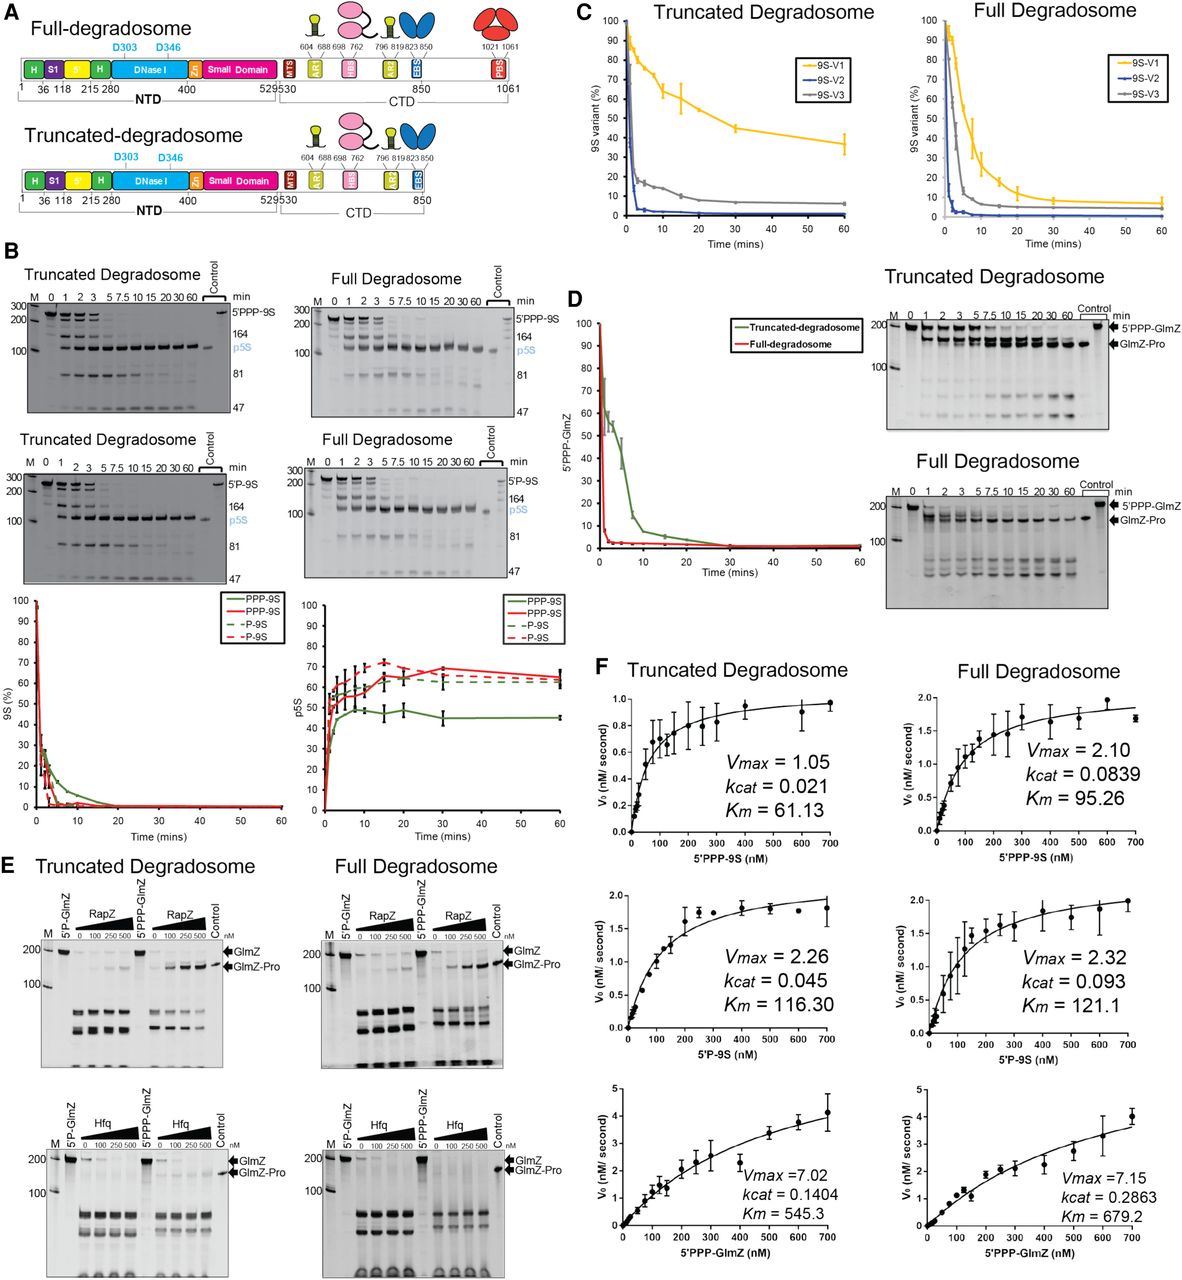
Substrate cleavage catalyzed by the RNA degradosome complex. (A) Schematics of the full degradosome (RNase E, enolase, RhlB, and PNPase) and truncated degradosome (RNase E, enolase, and RhlB) assemblies. (B) Time course cleavage assay showing processing of 9S RNA and production of the precursor RNA p5S for 9S RNA with 5′-triphosphate (PPP-9S, upper panel) and 5′-monophosphate (P-9S, middle panel). The lower panel shows integrated signal for 9S signal loss (plot on the left) and p5S signal gain (plot on the right) from 9S cleavage assays catalyzed by truncated degradosome (green lines) and full degradosome (red lines). (C) Plots of cleavage of 9S subdomains (9S-V1, 9S-V2, and 9S-V3) catalyzed by degradosome assemblies. (D) Plots of cleavage of GlmZ RNA catalyzed by the degradosome assemblies with the denaturing gels used to quantify signals shown on the right. (E) Denaturing gels showing the production of GlmZ-Pro by RNase E is sensitive to the presence of RapZ but not Hfq within the degradosome assembly too. (F) Michaelis–Menten plots used for determination of the kinetics parameters of the cleavage of 9S and GlmZ RNAs catalyzed by truncated degradosome and full degradosome. The plots were fitted using Prism (GraphPad Software) and represent mean of three representative plots of reaction rates vs substrate concentrations (see “Materials and Methods” for details). (H) RNase H-like domain, (S1) RNA binding S1 domain, (DNase I) DNase I-like domain, (5′) RNA 5′ site-sensing pocket, (Zn) Zn-linker, (MTS) membrane targeting site, (AR) Arginine-rich region/RNA binding site, (HBS) RhlB binding site, (EBS) Enolase binding site, and (PBS) PNPase binding site.




