


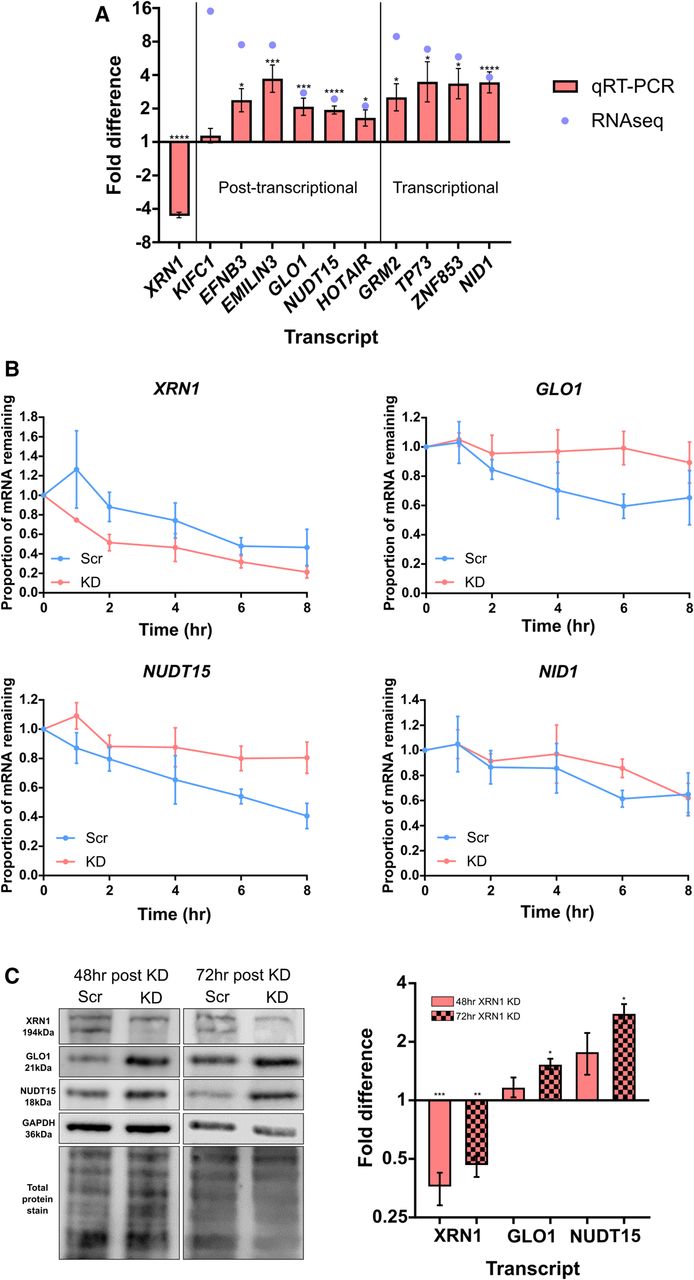
Validation of RNA-seq computational analysis. (A) qRT-PCR validation of 10 up-regulated transcripts in XRN1 knockdown cells demonstrating fold difference compared to the paired scrambled control. Error bars represent SEM, n ≥ 5, (*) P < 0.05, (**) P < 0.01, (***) P < 0.001, (****) P < 0.0001. (B) Decay profiles of selected transcripts following transcriptional inhibition by Actinomycin D (5 µg/mL) validate computational prediction. XRN1 demonstrates destabilization in XRN1 knockdown (KD) cells, GLO1 and NUDT15 demonstrate stabilization in the absence of XRN1, while NID1 shows no change between control (Scr) and knockdown cells. Error bars represent SEM, n ≥ 3. (C) Loss of XRN1 results in an increase in GLO1 and NUDT15 at the protein level 72 h post knockdown. Representative blot with both total protein stain and GAPDH loading control and subsequent quantification and fold difference compared to paired scrambled control. Error bars represent SEM, n ≥ 3, (*) P < 0.05, (**) P < 0.01, (***) P < 0.001.




