


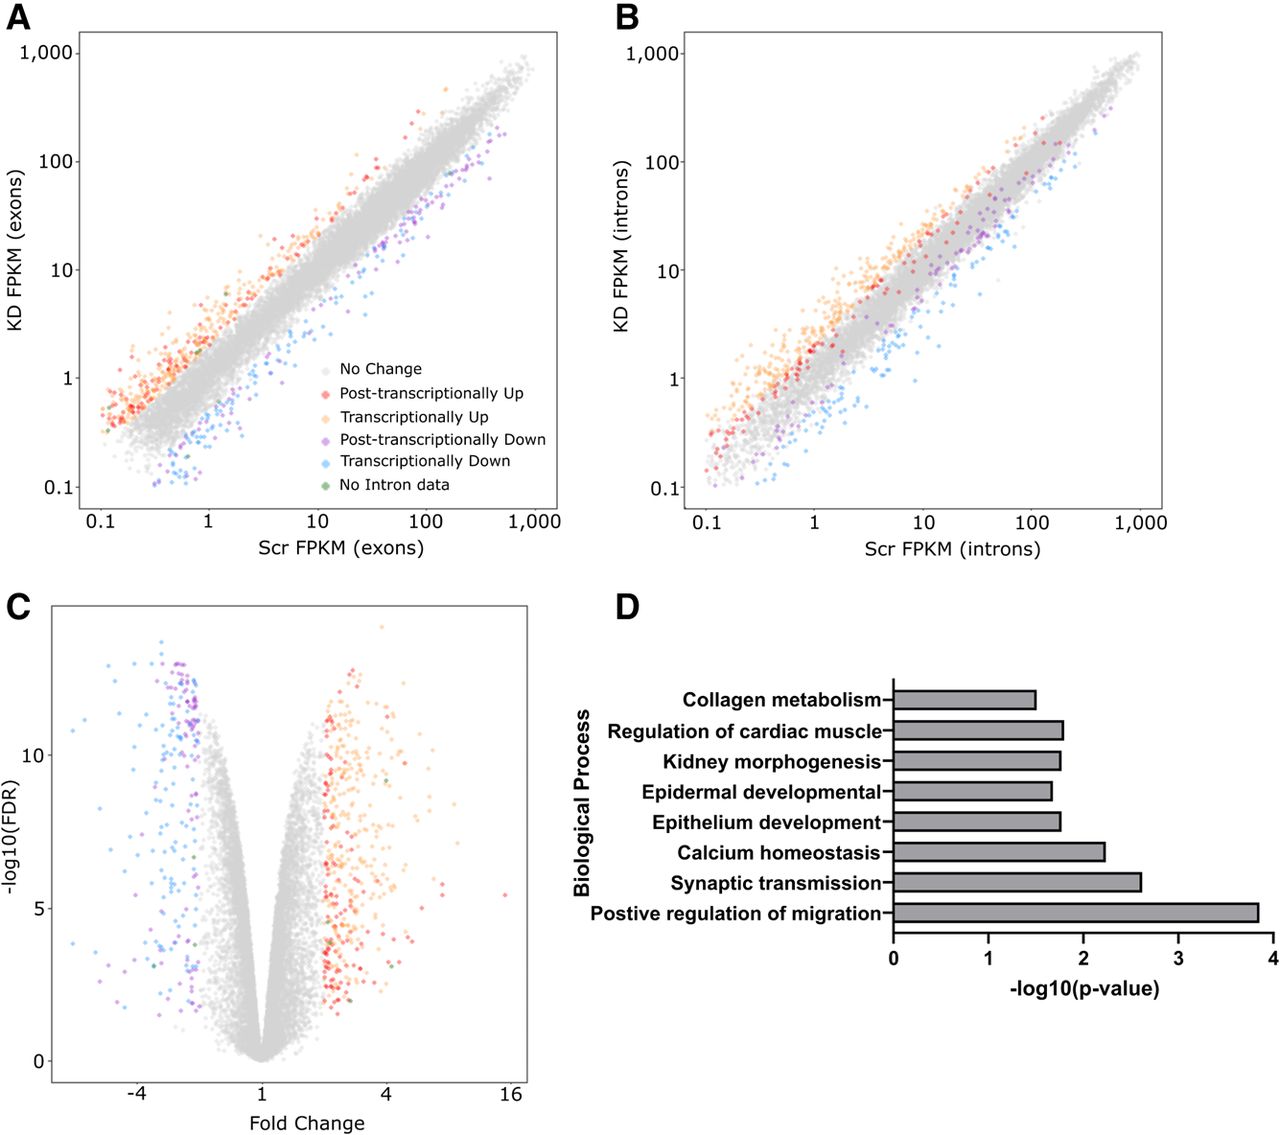
Overview of RNA-sequencing of XRN1-depleted SAOS-2 cells. (A) Scrambled versus XRN1 knockdown FPKM based demonstrating differentially expressed transcripts using exon counting. Exon FPKM used for direct comparison with intron counting. (Gray) No change, (red) post-transcriptionally up-regulated, (orange) transcriptionally up-regulated, (purple) post-transciptionally down-regulated, (blue) transcriptionally down-regulated, (green) no intron data. (B) Differentially expressed transcripts when counting intron mapping reads allowing differentiation between transcriptional and post-transcriptional changes represented in A. Legend as in A. (C) Volcano plot demonstrating statistical information of all expressed transcripts. Legend as in A. (D) Gene ontology analysis using DAVID and Biological processes level “BPFAT” at highest stringency on all differentially expressed transcripts in XRN1-depleted SAOS-2 cells.




