


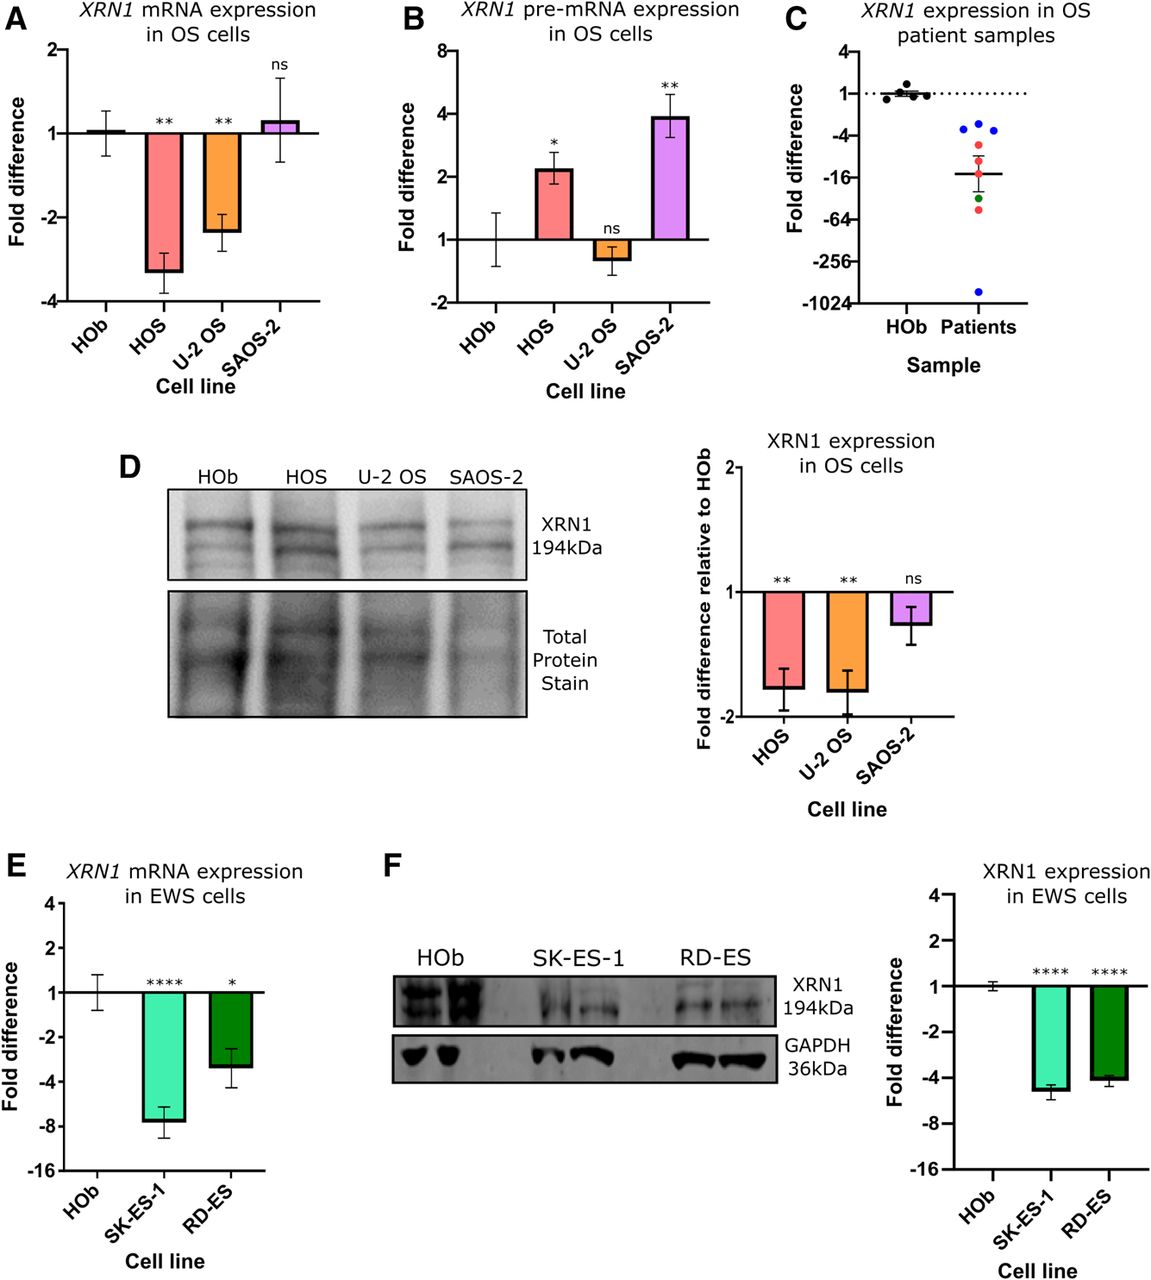
XRN1 is down-regulated in osteo- and Ewing sarcoma. (A) qRT-PCR quantification of XRN1 mRNA expression across osteosarcoma (OS) cell lines in comparison to the HOb control cell line, normalized to HPRT1. Error bars represent SEM, n ≥ 5. (B) qRT-PCR quantification of pre-XRN1 across osteosarcoma cell lines in comparison to the HOb control cell line, normalized to HPRT1. Error bars represent SEM, n ≥ 6. (C) qRT-PCR quantification of XRN1 across osteosarcoma patient samples in comparison to the HOb control cell line, normalized to PES1. Error bars represent SEM, n ≥ 5, P = 0.0296. (Red) Samples from hip and femur. (Blue) Samples from scapula or humerus. (Green) Unknown origin. (D) Representative western blot and graphical analysis showing expression of XRN1 protein in osteosarcoma cells as a proportion of that expressed in HOb control cells, normalized to a total protein stain. Error bars represent SEM, n ≥ 4, (**) P < 0.01. (E) qRT-PCR quantification of XRN1 mRNA expression in Ewing sarcoma (EWS) cell lines in comparison to the HOb control cell line, normalized to GAPDH. Error bars represent SEM, n ≥ 6. (F) Representative western blot and graphical analysis showing expression of XRN1 protein in Ewing sarcoma cells as a proportion of that expressed in HOb control cells. Error bars represent SEM, n ≥ 4. For all panels (****) P < 0.0001, (**) P < 0.01, (*) P < 0.05, and ns = P > 0.05.




