


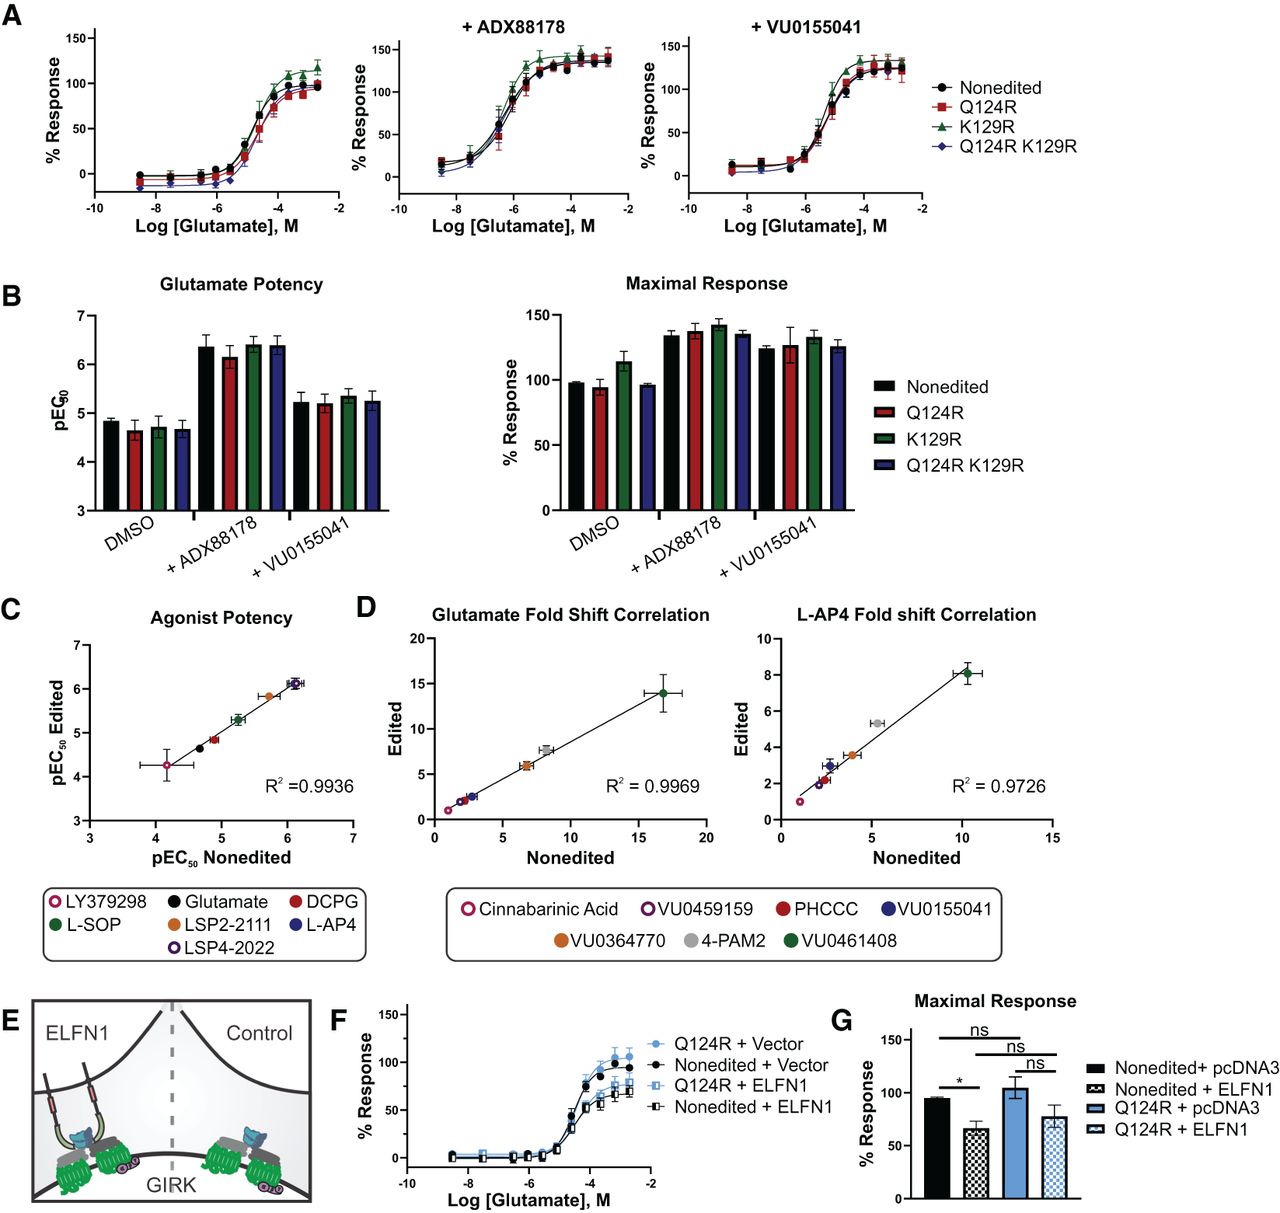
Comparison of signaling and ELFN1 interactions of edited and nonedited mGlu4 receptors. (A) Twelve-point concentration-response curves to glutamate ± the PAM VU0155041 (30 µM) or ADX88178 (30 µM), measuring thallium flux induced by mGlu4 nonedited and edited isoform activation after transient transfection into HEK-GIRK cells. Mean ± SEM. n = 3. Blank (WT vehicle signal) was subtracted from all values and normalized to Nonedited DMSO max response. Analyzed by one-way ANOVA. (B) pEC50 and maximal response values from the nonlinear regression curves shown in A. Linear regression analysis of the potency and fold shift (pEC50) of various mGlu4 (C) agonists and (D) PAMs in polyclonal cells expressing either nonedited or Q124R edited mGlu4 receptor. (E) Schematic representation of the coculture assay used to measure allosteric modulation of receptor isoforms by ELFN1. (F) Concentration-response curves for cells expressing mGlu4 edited isoforms cocultured with ELFN1 or control cells. n = 4. Mean ± S.E.M. (G) Maximal receptor response of data represented in F. Analyzed by paired t-test between vector control versus ELFN1 for nonedited or Q124R mGlu4.




