


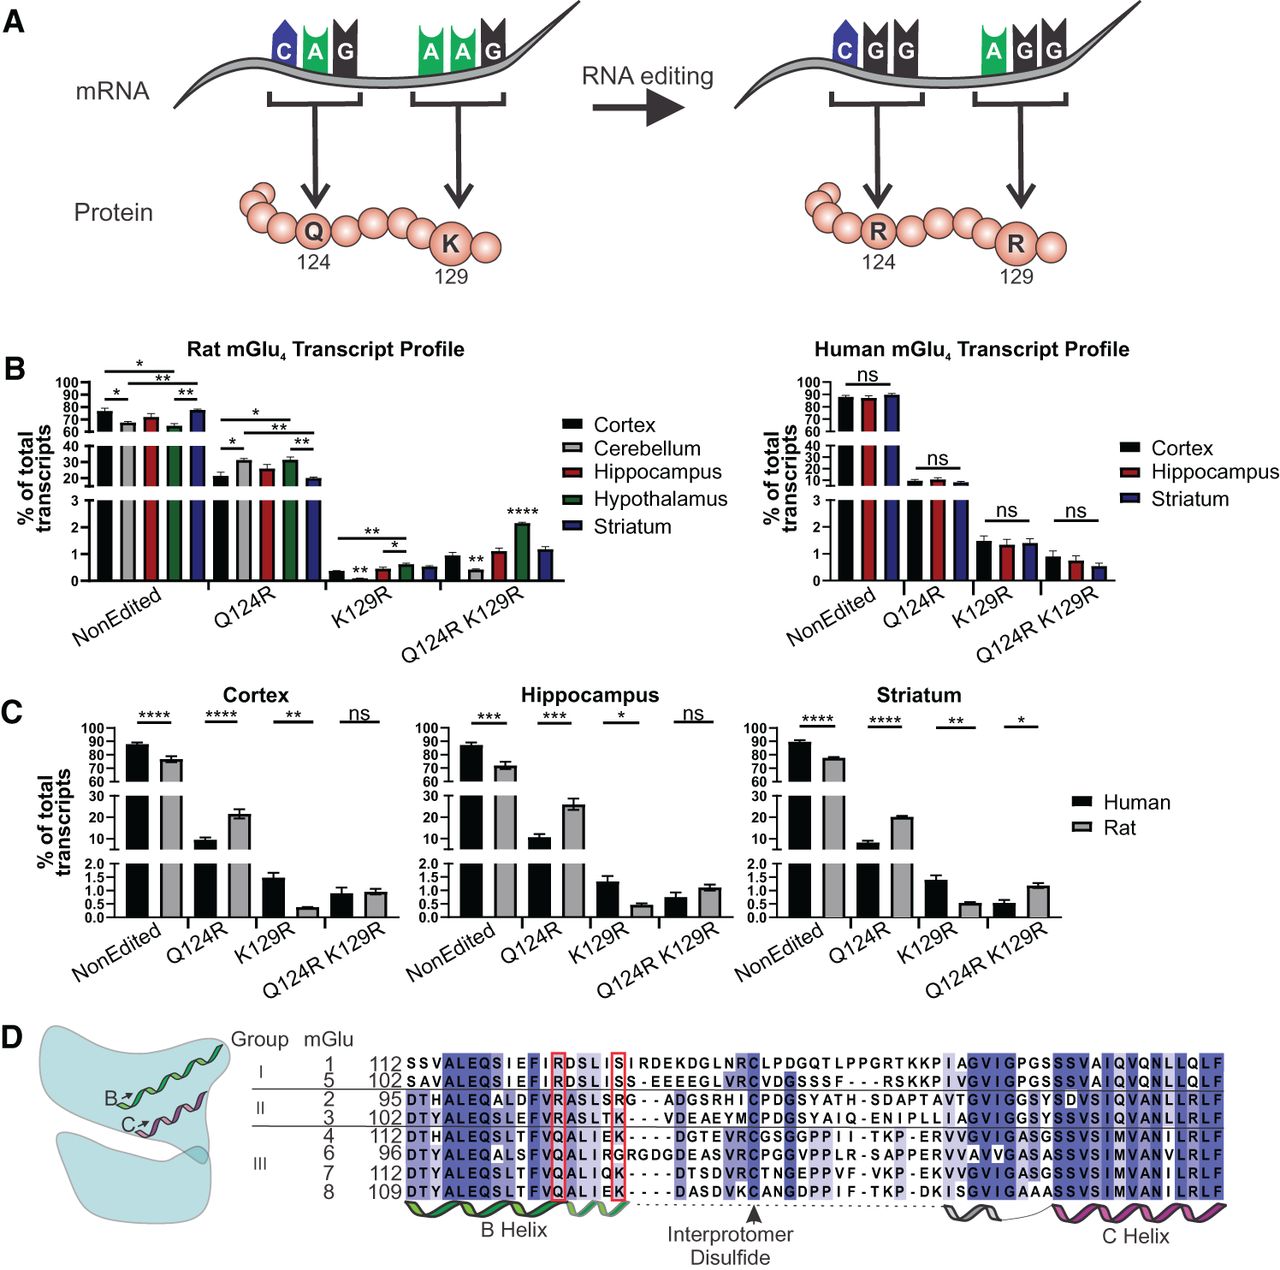
A-to-I editing of mGlu4 transcripts reveals conservation of editing between rodents and humans. (A) Cartoon depiction of mRNA codons altered by RNA editing and their predicted translation by the ribosome. Editing is depicted as changing an adenosine to guanosine because A-to-I editing is functionally an “A” to “G” conversion for the ribosome. (B) Transcript isoforms expressed as a percentage of the total mGlu4 transcript pool. Mean ± S.E.M. Significance tested by one-way ANOVA with Tukey's post hoc test (ns, P > 0.05; [*] P ≤ 0.05; [**] P ≤ 0.01; [***] P ≤ 0.001; [****] P ≤ 0.0001, rat n = 3, human n = 6–8). (C) Replot of the data in B to highlight the differences in human and rat brain regions. Mean ± S.E.M. Significance tested by one-way ANOVA with Sidak's post hoc test. (D) Editing alters two amino acids (Q124R, K129R) highlighted in red within the B helix of the ligand binding domain. The helices of both monomers come together to comprise the mGlu dimer interface. Helix B and C are denoted below the alignment. The portion of helix B which is maintained in both active and inactive receptor states is outlined in black below the alignment. The helix without outline represents the amino acids incorporated into helix B in the relaxed state of the receptor.




