


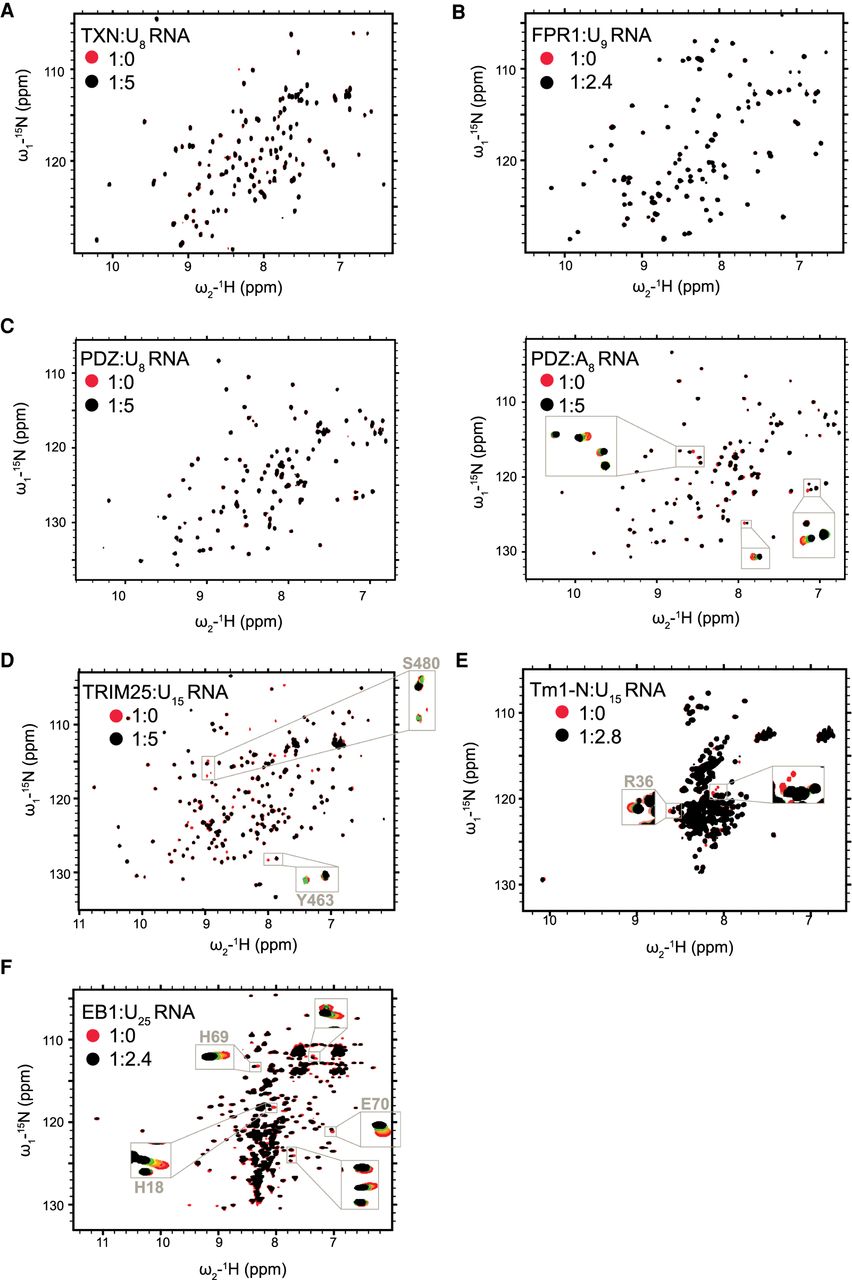
Interaction of novel RBPs with RNA. (A) 1H/15N-HSQC spectra of hsTXN titrated with poly(U)-8-mer; (B) scFpr1 titrated with poly(U)-9-mer; (C, left) hsSNTB1-PDZ domain titrated with poly(U)-8-mer; (C, right) and poly(A)-8-mer; (D) hsTRIM25-SPRY domain titrated with poly(U)-15-mer; (E) aTm1-N domain (I/C isoform) titrated with poly(U)-15-mer; (F) and dmEB1 titrated with poly(U)-25-mer. The spectra of the free proteins (in red) are overlaid with the spectra of proteins titrated with RNA (in black). The x-axis corresponds to the 1H dimension whereas the y-axis corresponds to the 15N dimension. Each peak represents an NH bond and depicts an individual residue. The ratio of protein to RNA is also shown. For EB1, Tm1, and TRIM25, full titration points for selected residues are shown in zoomed insets (protein:RNA = 1:0/0.2/0.6/1/1.6/2.4 [EB1]; 1:0/0.2/0.6/2/2.4/2.8 [Tm1]; 1:0.15/0.6/1.2/2.5/5 [TRIM25]; 1:0.5/1/2/3/4/5 [PDZ]; 1:1/2/3/4/5 [TRX] ratios).




