


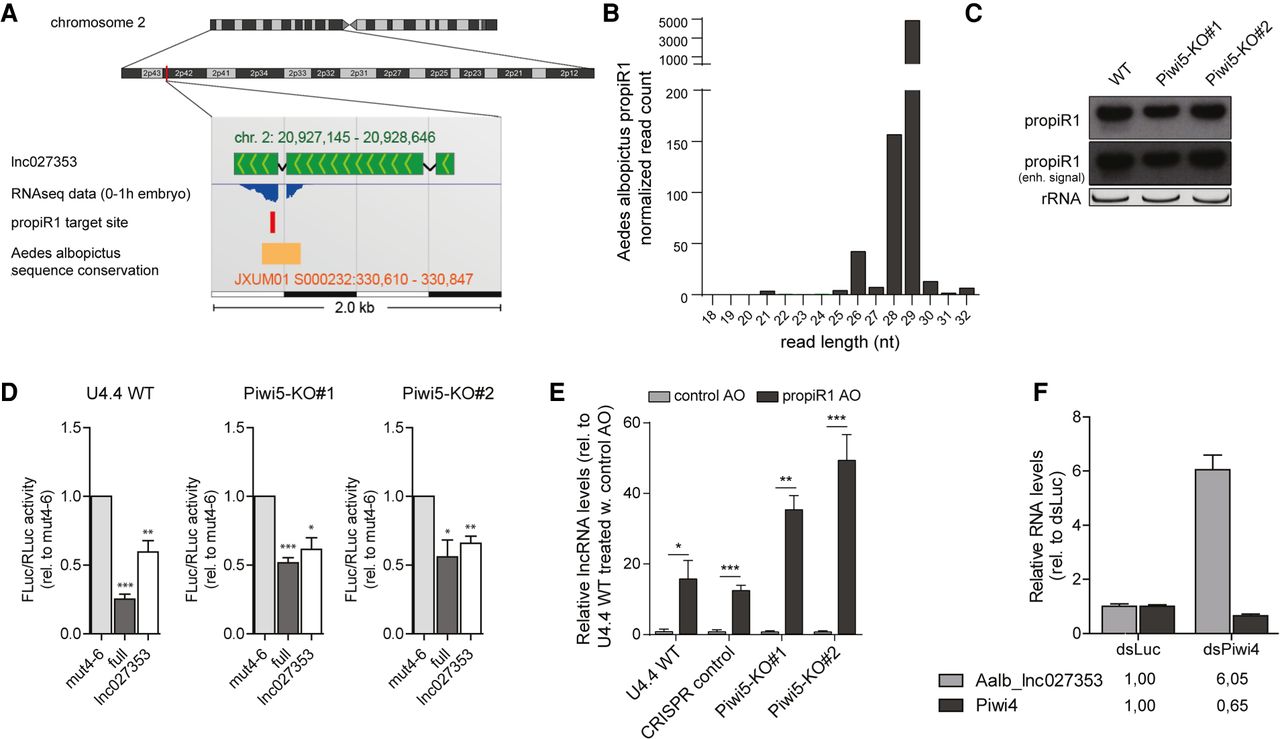
The propiR1-lnc027353 regulatory network is evolutionarily conserved. (A) Schematic representation of the genomic location of lnc027353 on Ae. aegypti chromosome 2. RNA-seq data from 0–1 h embryos (published under SRA accession SRS282183) are displayed using the Apollo genome browser accessible through VectorBase. The position of the propiR1 target site (red) and an area with high degree of sequence conservation to Ae. albopictus (orange) are indicated. (B) Size distribution of propiR1 isoforms in Ae. albopictus U4.4 cells. The read count is normalized to library size (per million reads). (C) Northern blot analysis of propiR1 in wild-type (WT) and two Piwi5 knockout clones (KO) of Ae. albopictus-derived U4.4 cells. The middle panel shows the propiR1 signal after the signal was enhanced to visualize the short propiR1 isoform. EtBr stained rRNA serves as loading control. (D) Luciferase assay in WT and Piwi5 KO U4.4 cells using reporters containing a control target site with mismatches at positions t4–6 (mut4-6), a fully complementary propiR1 target site (full) or the endogenous target site from Ae. aegypti lnc027353. Data were normalized to the activity of a cotransfected Renilla luciferase reporter (RLuc) and expression relative to mut4–6 is shown. Bars and whiskers represent the mean ± standard error of the mean of three independent experiments (depicted in Supplemental Fig. S9), each performed with three biological replicates. Asterisks mark significant changes in luciferase activity between the different reporters within the same cell line (unpaired two-tailed t-tests with Holm–Sidak correction; [*] P < 0.05, [**] P < 0.005, [***] P < 0.0005). (E) Expression of the Ae. albopictus lnc027353 ortholog in WT and Piwi5 KO U4.4 cells, measured by RT-qPCR, after treatment with 300 nM propiR1 or control antisense oligonucleotides (AO) for 48 h. CRISPR control is a clonal control cell line generated in parallel with the Piwi5 KO cell lines. Bars and whiskers depict the mean ± SD of three biological replicates. Asterisks mark significant changes in lnc027353 expression upon transfection with control and propiR1 AOs within the same cell line (unpaired two-tailed t-tests with Holm–Sidak correction; [*] P < 0.05, [**] P < 0.005, [***] P <0.0005). (F) Expression of the Ae. albopictus lnc027353 ortholog and Piwi4 in U4.4 cells upon Piwi4 knockdown (dsPiwi4), measured by RT-qPCR. Data are normalized to cells treated with control dsRNA targeting luciferase (dsLuc). Bars and whiskers depict the mean ± SD of three biological replicates.




