


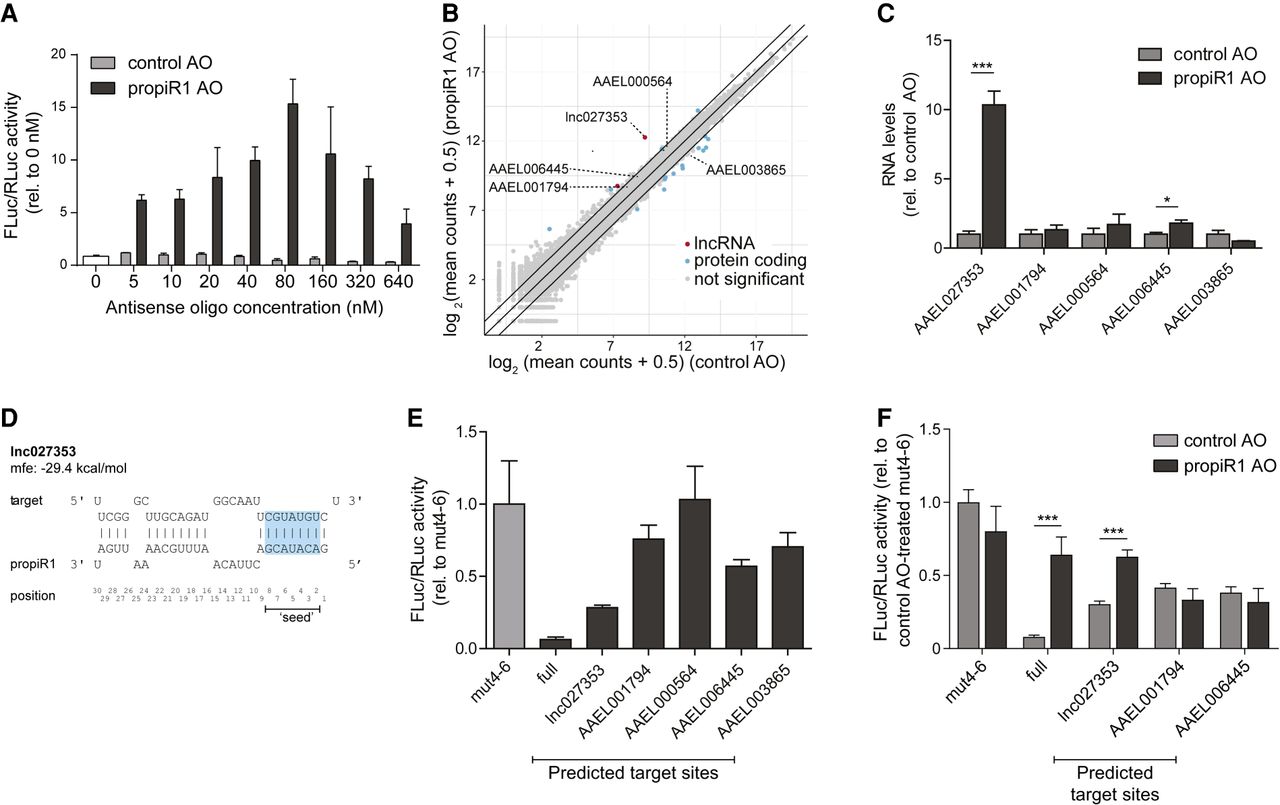
propiR1 regulates a limited set of cellular RNAs. (A) Luciferase assay using a firefly luciferase (FLuc) reporter bearing a fully complementary propiR1 target site in the 3′UTR. Increasing amounts of 2′-O-methylated, antisense RNA oligonucleotides for propiR1 (propiR1 AO) or a control sequence (control AO) were cotransfected with the propiR1 reporter plasmid. FLuc activity was normalized to the activity of a cotransfected Renilla luciferase (RLuc) reporter (same in E and F). Bars show the mean ± SD of a representative of two independent experiments, each performed with three biological replicates. (B) Log2 gene expression in Aag2 cells treated with propiR1 or control AOs. Mean RNA-seq counts of three biological replicates are shown (plus a pseudocount of 0.5 to plot values of zero). Significance was tested at an FDR of 0.01 and log2 fold change of 0.5. Diagonal lines highlight twofold changes. Significant, differentially expressed lncRNAs and protein-coding genes are indicated with red and blue dots, respectively; gray dots indicate genes that were not significantly affected by propiR1 AO treatment. (C) RT-qPCR of genes bearing propiR1 target sites after treatment of Aag2 cells with propiR1 or control AOs for 24 h. Shown are the mean ± SD of a representative of three independent experiments, each performed with biological triplicates. Asterisks denote statistically significant differences in gene expression between propiR1 and control AO-treated cells (unpaired two-tailed t-tests with Holm–Sidak correction; [***] P < 0.0005). (D) Schematic representation of the predicted propiR1-lnc027353 RNA duplex and its minimum free energy (mfe). Numbers indicate propiR1 piRNA positions (5′ to 3′) with the seed sequence (nt 2–8) in blue shading. (E) Luciferase assay of reporters containing predicted propiR1 target sites from genes differentially expressed upon propiR1 AO treatment. Depicted are the mean ± SD of a representative of three independent experiments, each with three biological replicates. Data are presented relative to the control reporter in which residues t4–6 were mutated (mut4–6). (F) Luciferase assay of reporters containing predicted propiR1 target sites upon cotransfection with propiR1 or control AOs. Bars represent the mean ± SD of four biological replicates. Data are presented relative to the mut4–6 control reporter treated with control AO. Asterisks denote statistically significant differences between control and propiR1 AO treatment (unpaired two-tailed t-tests with Holm–Sidak correction; [***] P < 0.0005).




