


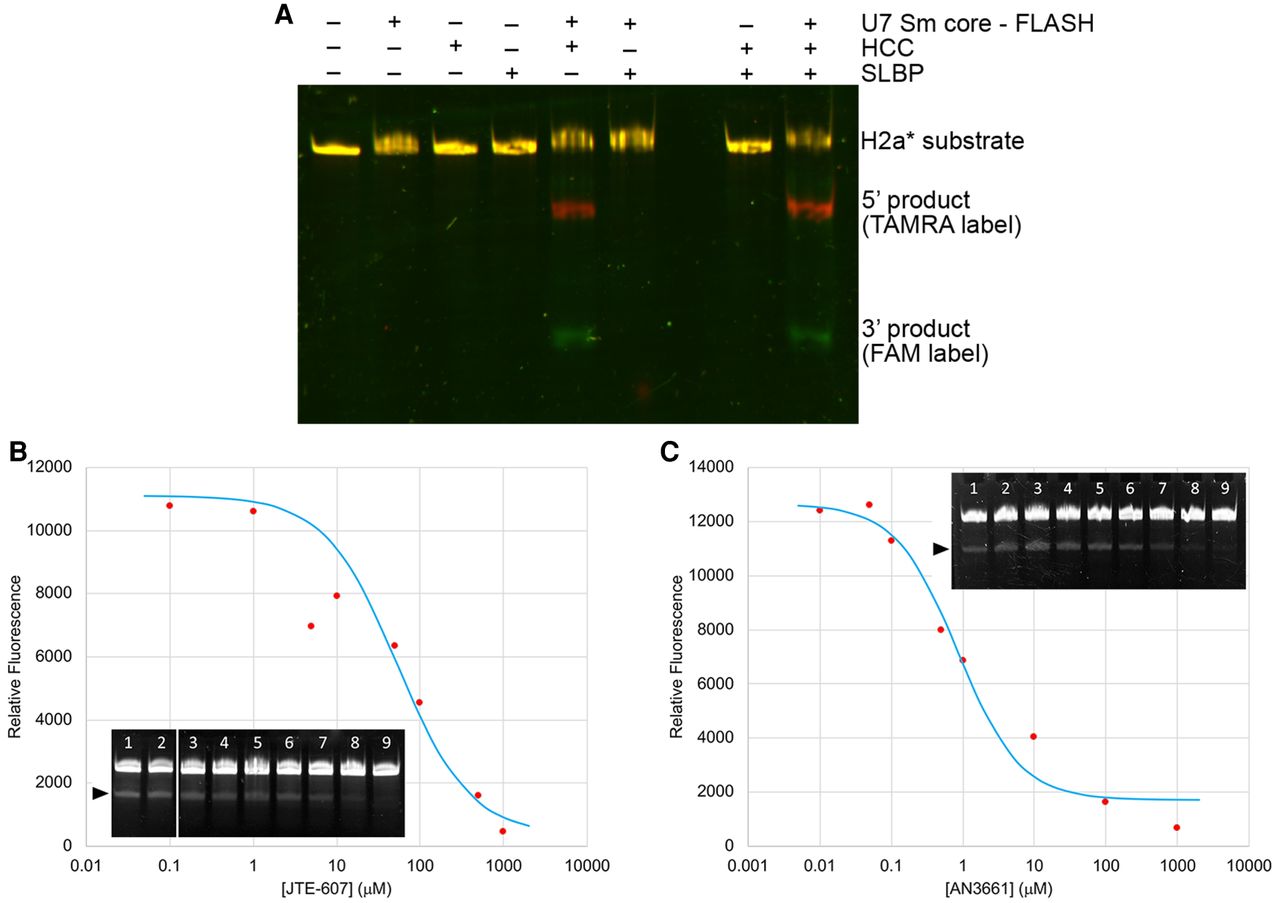
Characterization of human CPSF73 inhibition by JTE-607 and AN3661 by the gel-based end-point fluorescence assay. (A) The cleavage activity depends on U7 Sm core—FLASH complex and HCC. A composite image of the TAMRA signal (red) and FAM signal (green) is shown. The 3′ product is degraded to mononucleotides by the exonuclease activity of CPSF73. (B). Dose-response curve of the amount of 5′ product as a function of JTE-607 acid analog concentration. The curve shows the fitting to the data to determine IC50 value. The point at 5 µM JTE-607 was not included in the fitting. The inset shows a denaturing polyacrylamide gel image. The 5′ product with a TAMRA label is indicated with the arrowhead. The concentrations of JTE-607 from lane 1 to lane 9 are: 0, 0.1, 1, 5, 10, 50, 100, 500, 1000 µM. Only the signals from TAMRA are shown. (C) Dose-response curve of the amount of 5′ product as a function of AN3661 concentration. The inset shows a denaturing polyacrylamide gel image. The concentrations of AN3661 from lane 1 to lane 9 are: 0, 0.01, 0.05, 0.1, 0.5, 1, 10, 100, 1000 µM.




