


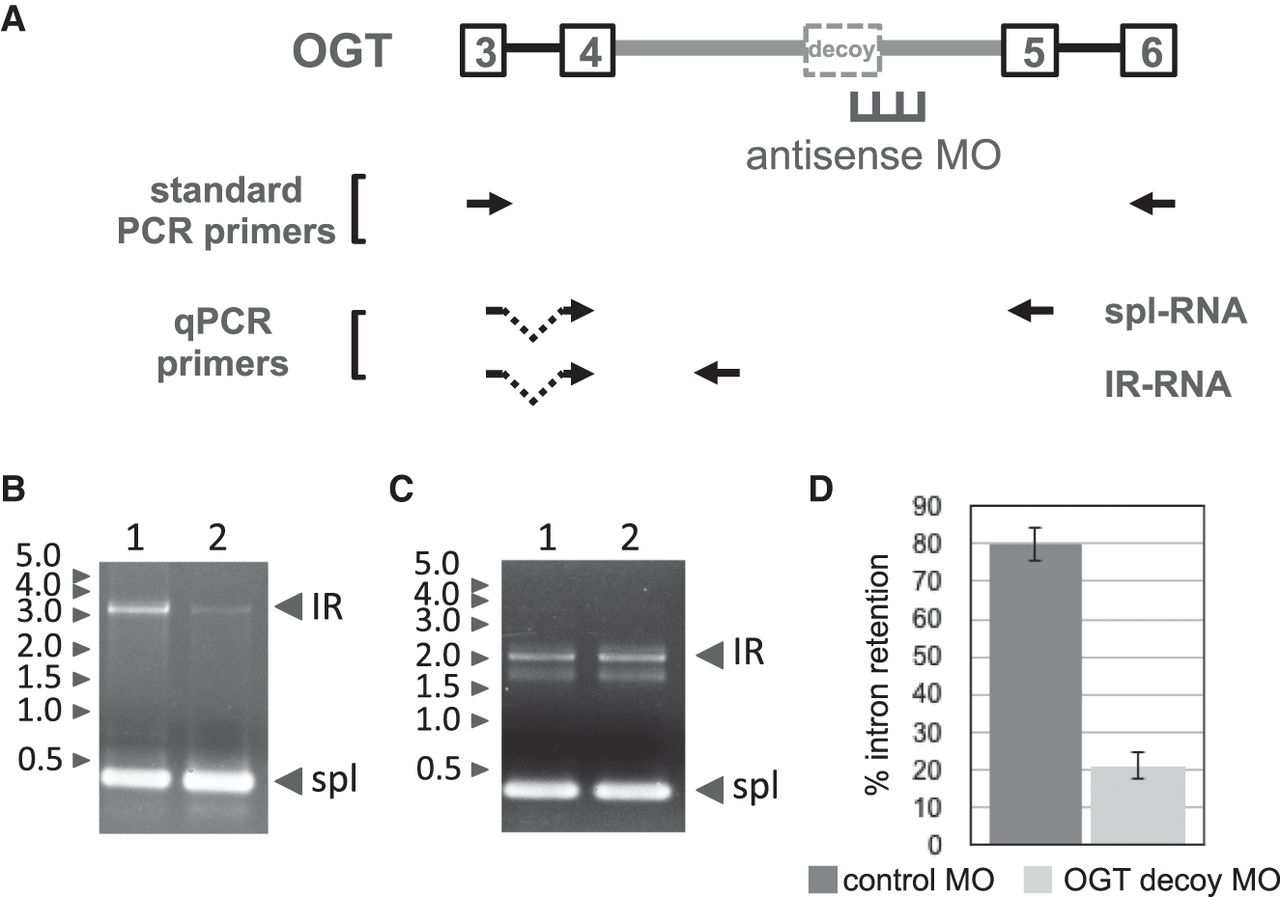
Antisense inhibition of OGR IR. (A) OGT gene structure in the IR region showing retained intron 4 (thick gray line) with its decoy exon and flanking exons. Position of antisense MO designed to block the 5′ splice site is shown, along with primer pairs used for RT-PCR. (B) Gel analysis of IR and spliced bands amplified from endogenous OGT transcripts by standard RT-PCR from cells treated with negative control MO (lane 1) or OGT decoy-specific MO (lane 2). (C) As a control for decoy-specific effects of the MO treatment, gel analysis of IR and spliced bands amplified from endogenous SF3B1 transcripts after treatment with negative control MO (lane 1) or OGT decoy-specific MO (lane 2). (D) OGT IR, as a percentage of total OGT transcripts, in cells treated with negative control or decoy-specific MO. IR was assessed using RT-qPCR. Results show average IR from data of four experiments. Error bars indicate standard deviation.




