


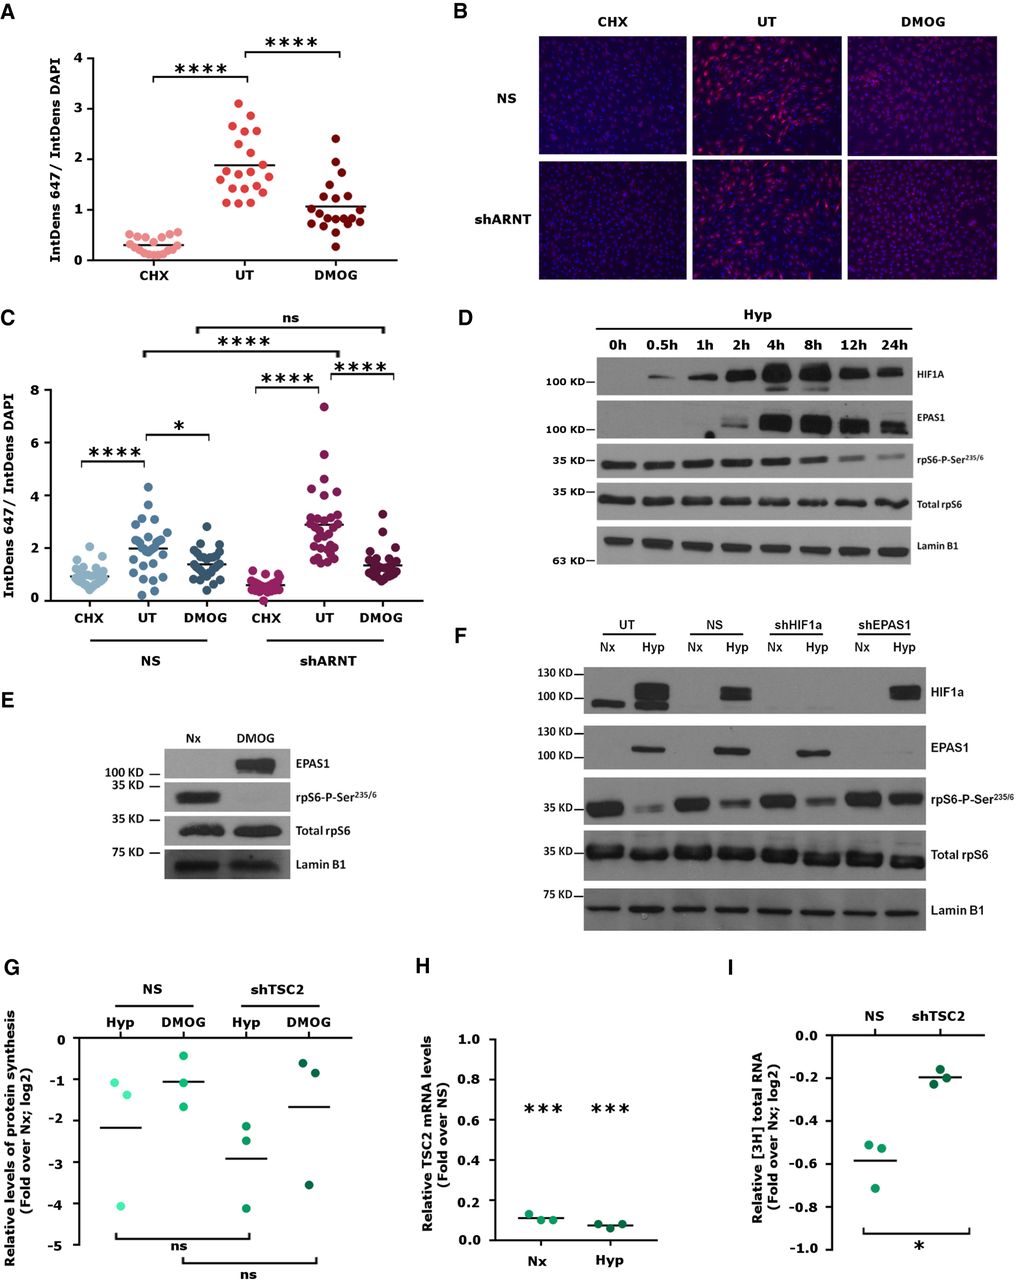
Inactivation of mTOR through TSC2 induces RNA decay in hypoxia. (A) Ratio of the integrated density of the 647 fluorescence divided by the integrated density of the DAPI fluorescence determined by Click-iT Plus OPP Alexa Fluor 647 Protein Synthesis Assay Kit in HUVEC cells grown 16 h with cycloheximide (CHX), DMOG (DMOG), or untreated (UT). The 647 fluorescence of CHX and DMOG treatment was significantly lower than that of untreated cells (UT) (CHX P-value < 0.0001, DMOG P-value < 0.0001. Unpaired Student's t-test). The experiment was repeated in duplicate, a representative experiment is shown. Each dot represents an individual cell. (B) Images of the fluorescence determined by Click-iT Plus OPP Alexa Fluor 647 Protein Synthesis Assay Kit shown in Figure 4C. (C) Ratio of the integrated density of the 647 fluorescence divided by the integrated density of the DAPI fluorescence determined by Click-iT Plus OPP Alexa Fluor 647 Protein Synthesis Assay Kit in HUVEC cells grown 16 h with cycloheximide (CHX), DMOG (DMOG), or untreated (UT). HUVEC cells transduced with lentiviral particles expressing a shRNA to silence ARNT (shARNT) or control shRNA (NS). The 647 fluorescence of CHX and DMOG treatment was significantly lower than that of untreated cells (UT) in both conditions: in shARNT cells and in control cells. ([****] Adjusted P-value < 0.0001; [*] adjusted P-value = 0.0104, two-way ANOVA followed by Tukey's multiple comparison test). Hypoxia did not have a different effect in cells whose ARNT expression was silenced, compared with the control cells ([ns] adjusted P-value > 0.999; two-way ANOVA followed by Tukey's multiple). Each dot represents an individual cell. The graph represents a representative experiment that was performed in duplicate. (D) HUVEC were exposed to hypoxia for the indicated periods of time and the level of HIF1, EPAS1, phospho-S6 Ribosomal Protein (rpS6), total rpS6 and lamin B1 were determined by immunoblot. (E) HUVEC were treated with DMOG (DMOG) or vehicle (Nx) for 16 h and the levels of phospho-S6 Ribosomal Protein (rpS6), total rpS6 and lamin B1 were determined by immunoblot. (F) HUVEC cells transduced with lentiviral particles expressing a shRNA to silence HIF1A (shHIF1a) or EPAS1 (shEPAS1) expression, a control shRNA (NS) or mock infected (UT) were exposed to normoxia (Nx) or hypoxia (Hyp) for 16 h. The level of HIF1, EPAS1, phospho-S6 Ribosomal Protein (rpS6), total rpS6, and lamin B1 were determined by immunoblot. (G) Ratio of the radioactivity incorporated into proteins precipitated with TCA over total label in cell extracts of hypoxic or DMOG-treated HUVEC cells compared with normoxic extracts. HUVEC cells were transduced with lentiviral particles expressing a shRNA to silence TSC2 (shTSC2) or control shRNA (NS). Each dot represents a single experiment. Silencing of TSC2 expression did not result in any statistical difference with the control cells (P-value = 0.1632 and P-value = 0.44 for Hyp and DMOG treated cells, respectively. Paired Student's t-test). (H) TSC2 mRNA levels in HUVEC cells transduced with lentiviral particles expressing a shRNA to silence TSC2 expression versus control (NS). TSC2 expression was on average 11% and 7% of that in control cells in normoxia and hypoxia, respectively, and significantly different to the expected value of 1 (single sample Student's t-test, P < 0.0001 for cells under normoxia and hypoxia). (I) Pulse-labeling of total RNA determined in control HUVEC cells (NS) and cells whose TSC2 expression was silenced (shTSC2). The graph represents the logarithm of the ratio of the hypoxic (16 h) remaining radioactivity normalized by normoxic values. Each dot represents a determination from a single experiment. The effect of hypoxia on RNA is significantly reduced by silencing TSC2 expression (P-value = 0.0288; paired Student's t-test).




