


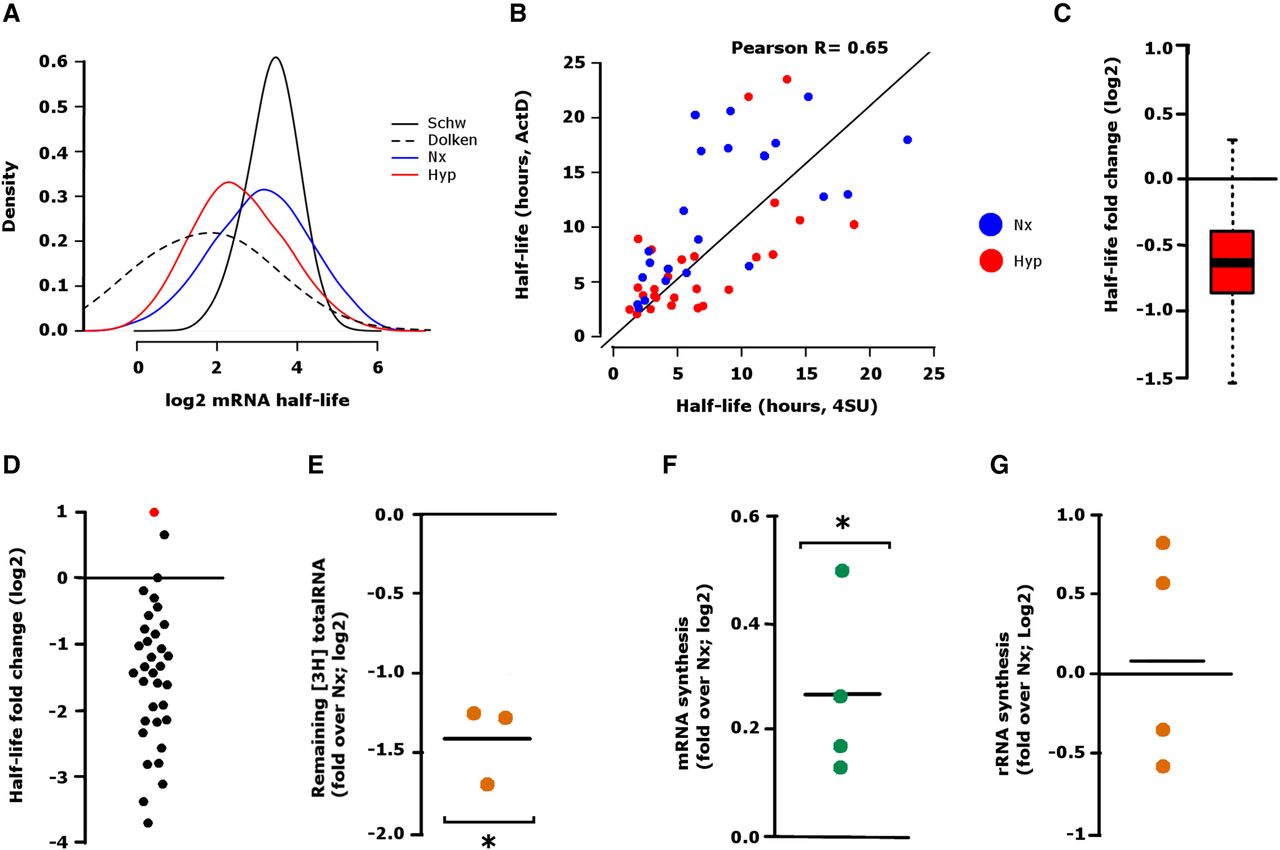
Decrease of mRNA and total RNA half-lives under hypoxic conditions. (A) Distribution of mRNA half-lives, determined by 4sU pulse-labeling as indicated in Materials and Methods, in normoxic (blue) and hypoxic (red) HUVEC. The values published in Dolken et al. (2008) (Dolken, dotted line) and (Schwanhausser et al. 2011) (Schw, black line) are overlapped for comparison. (B) Comparison of individual half-life values obtained by the high-resolution gene expression profiling experiment and the data derived from the determination of mRNA half-life upon inhibition of RNA-pol with actinomycin D. (F(1,49) = 168, P < 0.001, linear regression R2 = 0.77) (C) Distribution of changes in decay rates induced by hypoxia, as determined in the high-resolution profiling experiments, represented as the logarithm of the ratio of the half-life in hypoxia over normoxia. (D) The graph represents the half-life of individual genes, calculated upon inhibition of RNA-pol with actinomycin D, in HUVEC cells in normoxia versus hypoxia as log2 of the ratio. Each dot represents the mean of three independent experiments. The red dot represents VEGFA. (E) Pulse-labeling of total RNA determined in HUVEC. The graph represents the logarithm of the ratio of the hypoxic (16 h) remaining radioactivity normalized by normoxic values. The comparison of the observed ratios was significantly higher than expected from a sample with a mean log2-ratio of 0 (single sample Student's t-test, P-value = 0.0122). (F) The amount of mRNA in the newly synthesized mRNA fraction (4sU-labeled) from the experiment described in Figure 1A was determined by spectrophotometry and represented as the log2 of the ratio of the values obtained in hypoxia over normoxia. Each point represents data from an independent experiment. The comparison of the observed ratios was significantly higher than expected from a sample with a mean log2-ratio of 0 (single sample Student's t-test, P-value = 0.049). (G) 47S rRNA precursor levels were determined by RT-qPCR in cells exposed overnight to normoxia or hypoxia and values normalized to 28S rRNA content. Each dot represents the ratio hypoxia over normoxia in an independent experiment. The observed ratios were not significantly different to the expected value of 0 (single sample Student's t-test, P = 0.8185).




