


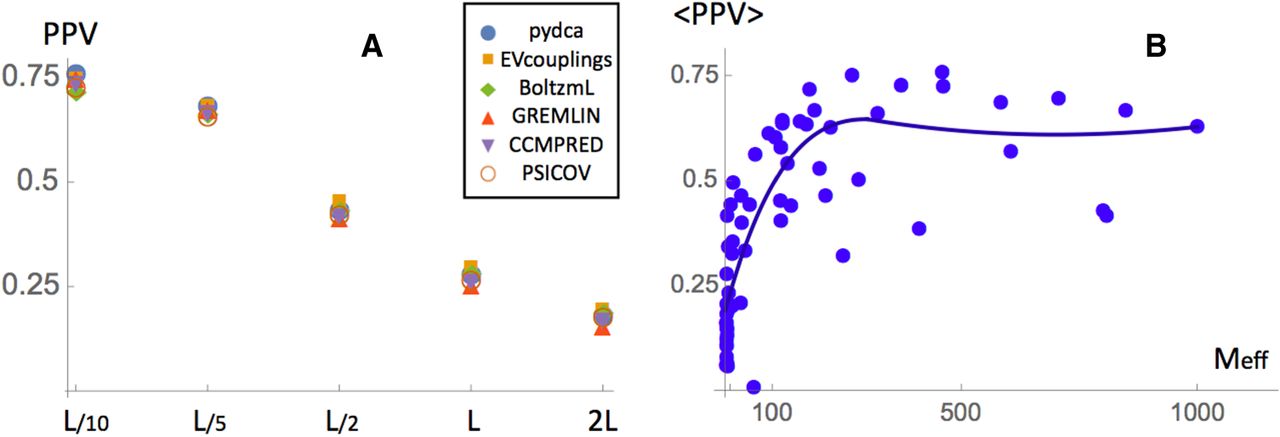
FIGURE 1.
(A) Prediction performances of the different methods analyzed in this paper measured by PPV as a function of the number of top scoring contacts. All contacts that are separated along the sequence by at least 4 nt are considered. (B) Averaged PPV of all prediction methods as a function of the effective number of sequences Meff.




