


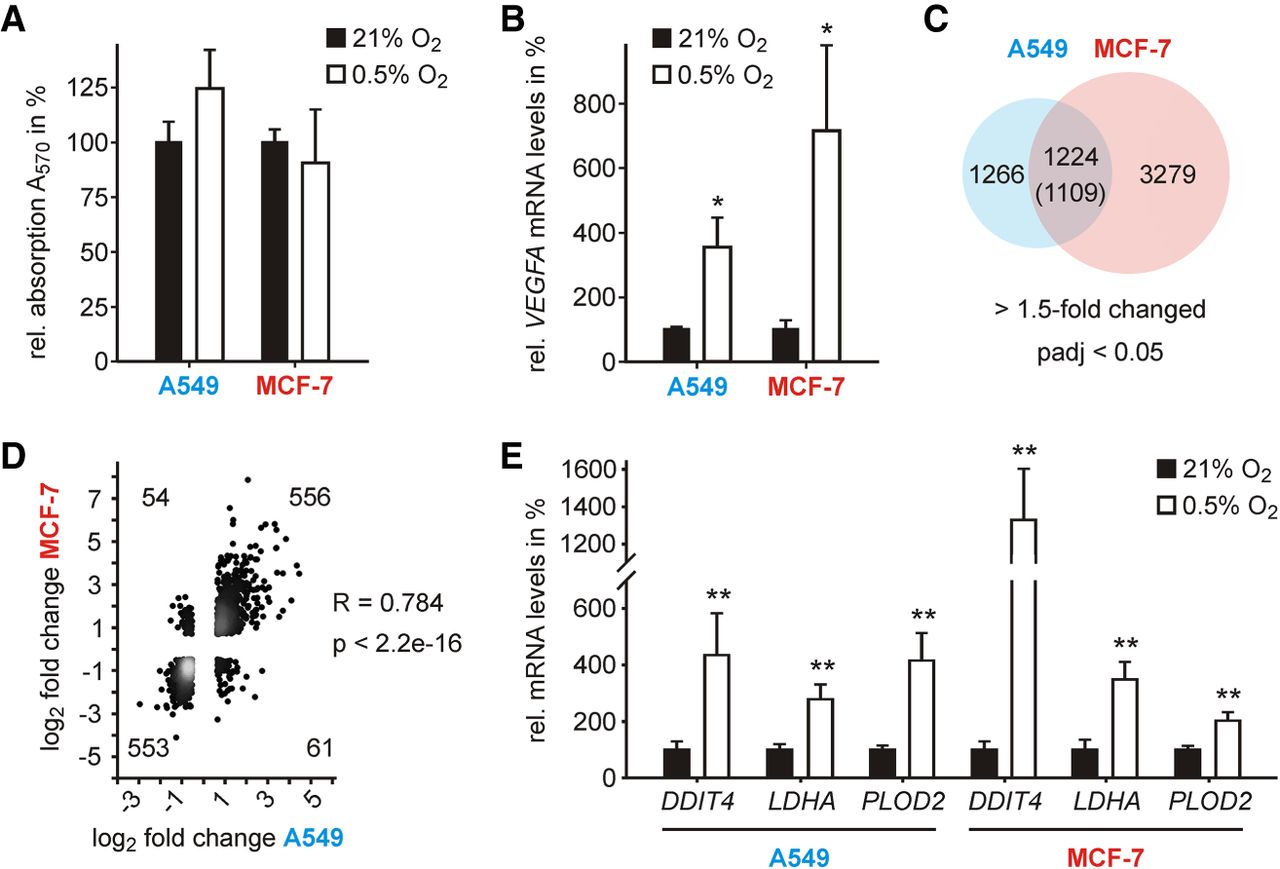
Chronic hypoxia induces highly correlated changes in transcript abundance in breast and lung cancer cells. (A) Comparison of the cell viability of A549 and MCF-7 cells cultivated for 48 h under normoxic (21% O2) or hypoxic (0.5% O2) conditions. n = 3. (B) RT-qPCR quantification of VEGFA mRNA levels in normoxic and hypoxic A549 and MCF-7 cells. Values are normalized to the housekeeping gene RPLP0. n = 3 (A549) and n = 4 (MCF-7). (C) Venn diagram showing the overlap of differentially expressed genes in A549 and MCF-7 cells in response to hypoxia. P < 9.52 × 10−124 (Fisher's exact test, one-tailed). The number in brackets refers to genes regulated in the same direction. (D) Scatter plot comparing the log2-transformed fold changes (hypoxia/normoxia) of 1224 shared differentially expressed genes in A549 and MCF-7 cells. Pearson correlation coefficient and associated P-value are given. (E) RT-qPCR quantification of the mRNA levels of hypoxia-induced genes in normoxic and hypoxic A549 and MCF-7 cells. Values are normalized to the housekeeping gene RPLP0. n = 5. (**) P < 0.01, (*) P < 0.05.




