


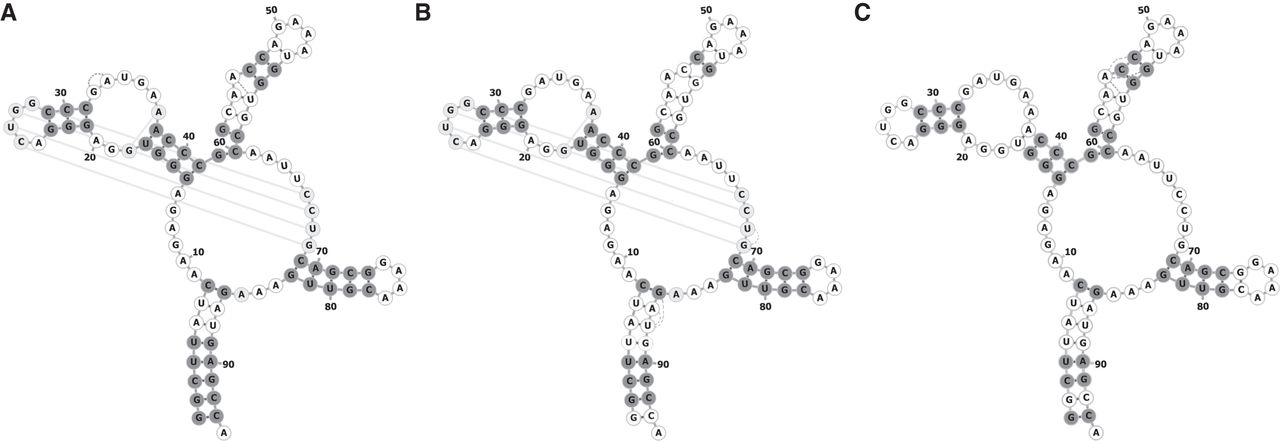
FIGURE 6.
SAM riboswitch (PDB code 2GIS), best accurate pseudolikelihood prediction (A), and respective Boltzmann learning prediction (B). Correctly predicted contacts in secondary structure are shown in dark gray. Correctly predicted tertiary contacts are shown in light gray. False positives are shown with dashed lines. Prediction with R-scape is shown in C.




