


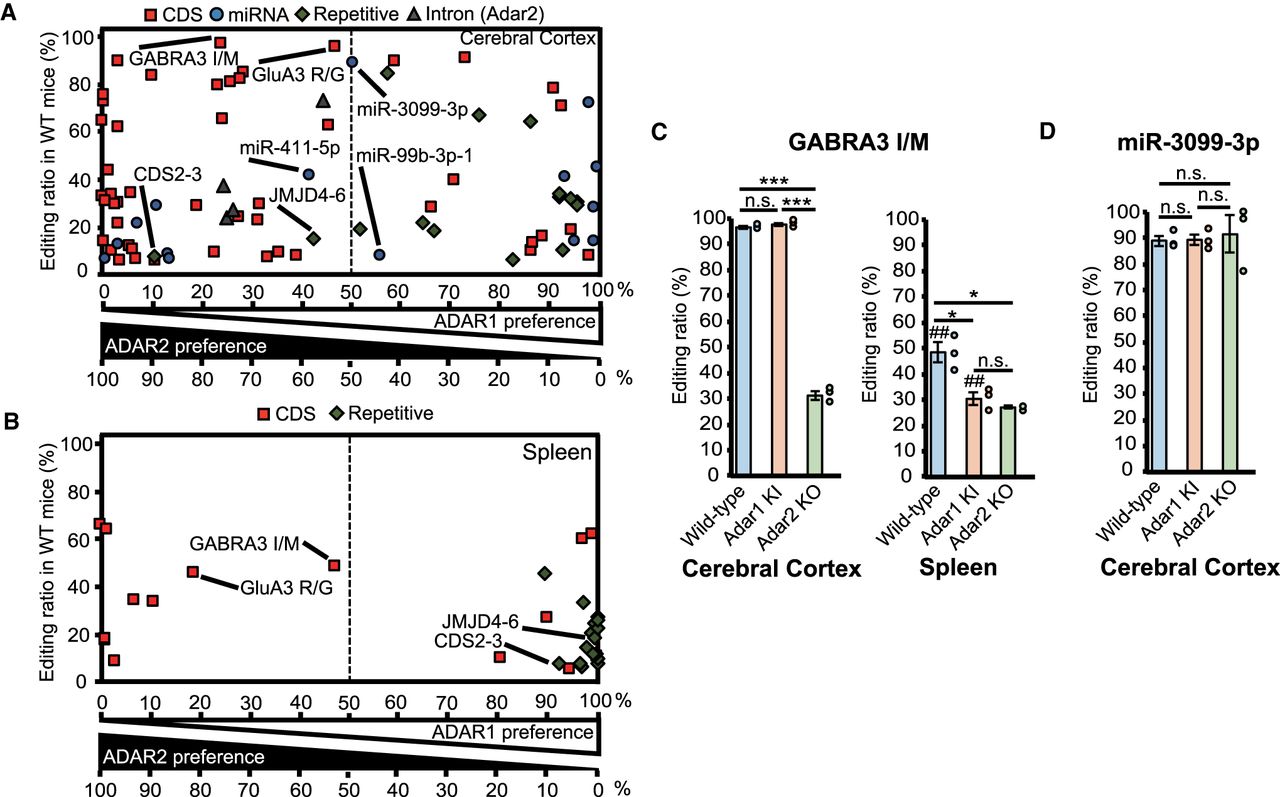
Contribution of each ADAR to each editing site. (A–B) ADAR preference in the cerebral cortex (A) and spleen (B). We compared values of the editing retention for each site between Adar1E861A/E861AIfih−/− mice (Adar1 knock-in [KI]) and Adar2−/−Gria2R/R (Adar2) knockout (KO) mice and defined the value of the editing retention in Adar1 KI as “A” and that in Adar2 KO as “B.” We calculated ADAR1 and ADAR2 preferences using the following formula: 100 × B/(A + B) and 100 × A/(A + B), respectively. Editing ratios in wild-type (WT) mice are shown on the vertical axes. In this figure, 100% of the ADAR preference indicates the sole contribution of a single ADAR to RNA editing at a certain site, and 50% indicates an equal contribution of both ADARs. The red squares, blue circles, green diamonds, and gray triangles represent editing sites in coding sequences (CDS), microRNAs (miRNAs), repetitive elements (REs), and introns, respectively. See Supplemental Charts to access an interactive version of these charts in which each editing site can be identified. (C,D) Editing ratios for the GABRA3 isoleucine/methionine (I/M) site (C), and the site in miR-3099-3p (D) in indicated tissues isolated from WT, Adar1 KI, and Adar2 KO mice are shown. Editing ratios are displayed as the mean ± SEM (n = 3 mice for each group; Student's t-test, [*] P < 0.05, [***] P < 0.001, n.s., not significant). The editing ratio of each mouse is also displayed as a circle on the right side of each column. Significant differences in editing ratios between the cerebral cortex and spleen in the same mutant mice are indicated by hashes (##) P < 0.01.




