


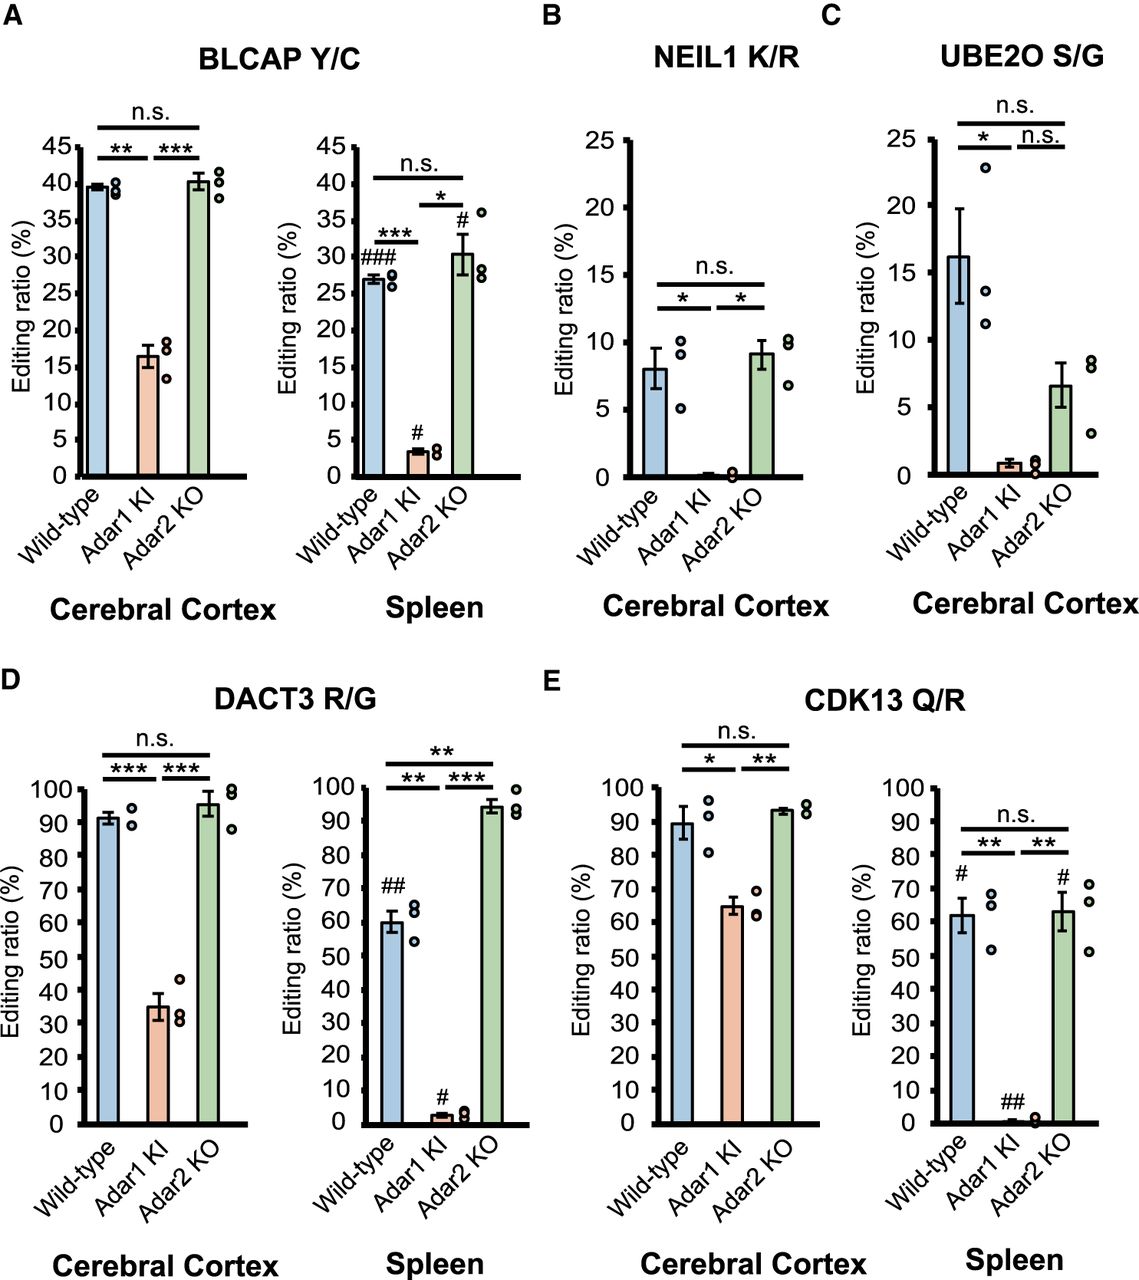
Retention of RNA editing at known and novel ADAR1 sites in Adar1 KI and Adar2 KO mice. (A–E) Editing ratios for BLCAP tyrosine/cysteine (Y/C) (A), NEIL1 lysine/arginine (K/R) (B), UBE2O serine/glycine (S/G) (C), DACT3 arginine/glycine (R/G) (D), and CDK13 glutamine/arginine (Q/R) sites (E) in indicated tissues isolated from wild-type (WT), Adar1E861A/E861AIfih−/− mice (Adar1 knock-in [KI]), and Adar2−/−Gria2R/R (Adar2 knockout [KO]) mice are shown. Editing ratios are displayed as the mean ± SEM (n = 3 mice for each group; Student's t-test, [*] P < 0.05, [**] P < 0.01, [***] P < 0.001, n.s., not significant). The editing ratio of each mouse is also displayed as a circle on the right side of each column. Significant differences in editing ratios between the cerebral cortex and spleen in the same mutant mice are indicated by hashes (#) P < 0.05, (##) P < 0.01, (###) P < 0.001.




