


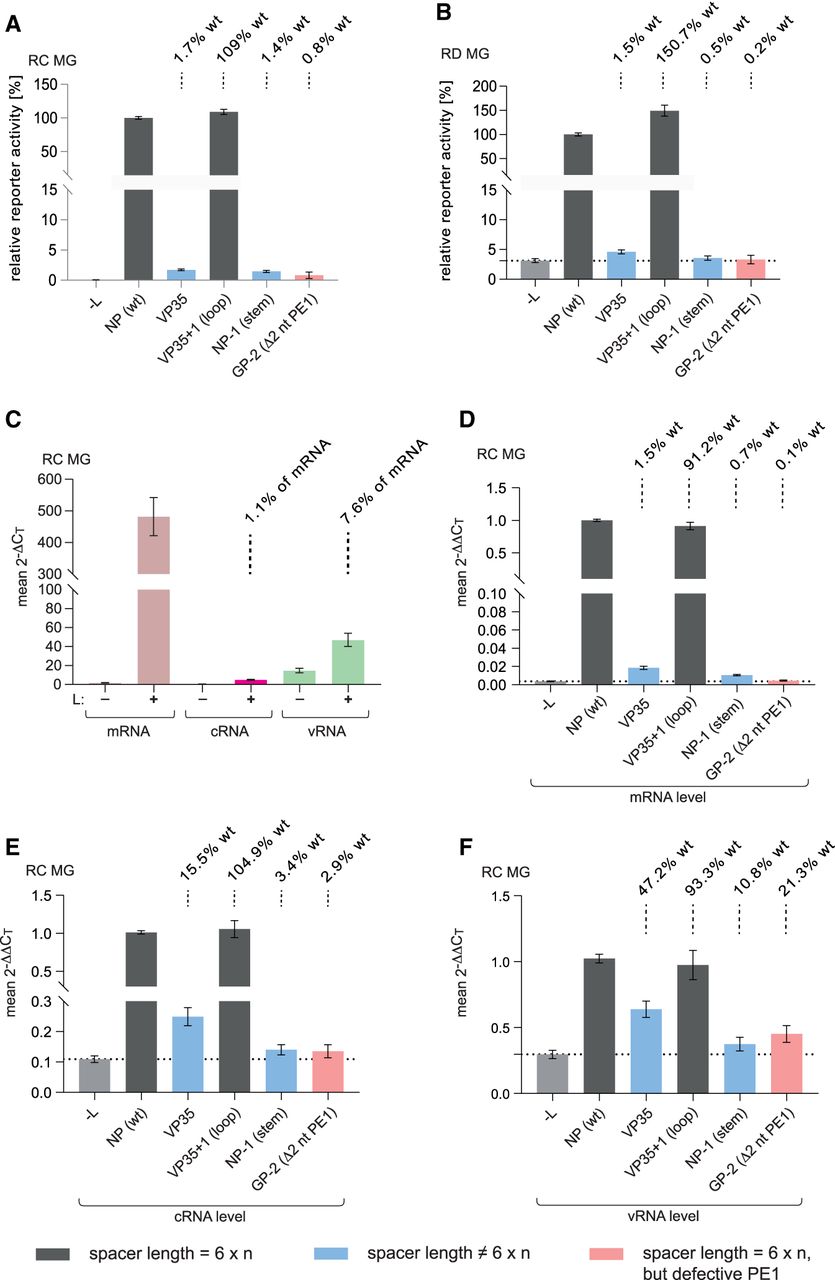
Impact of hexamer phasing in the 3′-leader on transcription and replication. (A) Relative reporter activity of RC MGs with replacements of the NP (wt) HP as indicated (for structural details of leader variants, see Figs. 3, 4B). (B) As in panel A, but the same 3′-leader variants integrated into the RD MG scaffold. Mean values (±SEM), normalized to the native NP (wt) leader construct, are based on three biological replicates with two or three technical replicates each. Above each column, we calculated the activity (in %) of the individual mutant MG relative to the NP (wt) MG (=100%) after subtraction of the −L background from both. The diagrams in panels A and B combine results already shown in Figures 4 and 5. (C) Mean 2−ΔCT values obtained with RNA isolated from cells transfected with the NP (wt) MG to illustrate the abundance of viral mRNA (pink), cRNA (magenta), and vRNA (green), measured by a two-step strand-specific qRT-PCR of RC MG samples using the same cells as in panel A; the presence (+) or absence (−) of L is indicated below the x-axis. 2−ΔCT values were calculated for each experiment individually; mean 2−ΔCT values (±SEM) were derived from six to 16 independent experiments with three technical replicates each. 2−ΔCT values for mRNA were calculated as follows, based on the mean CT (±SEM) values of 14.52 ± 0.15 for mRNA + cRNA, 20.97 ± 0.11 for cRNA, and 23.42 ± 0.09 for firefly luciferase mRNA: CT (mRNA + cRNA) minus CT (firefly luciferase mRNA), that is, 14.52 − 23.42 = −8.9, corresponding to a 2−ΔCT value of 477.7; CT (cRNA) minus CT (firefly luciferase mRNA), i.e. 20.97 − 23.42 = −2.45, corresponding to a 2−ΔCT value of 5.46; subtracting 5.46 from 477.7 then gives the 2−ΔCT value of 472.24 for mRNA. Above the cRNA and vRNA columns (+L), we calculated the mole percentage for cRNA and vRNA relative to mRNA (pink column) after subtraction of the corresponding −L background controls. For the binding sites of primer pairs, see Supplemental Figure S2. (D–F) Relative levels of viral mRNA, cRNA, and vRNA using the same cells as in panel A and normalized to the NP (wt) construct. Mean 2−ΔΔCT values (±SEM) were derived from at least three independent experiments with two or three technical replicates each. Dotted horizontal lines mark the level of the −L control. For experimental details, see Materials and Methods.




